UK and Ireland windiness 2024: Slightly lower than long-term averages

What are the implications for you?

Monitoring and recording wind speed trends can provide valuable insights for assessing project performance. But interpreting, understanding, and acting on those trends is where companies are unlocking significant value. So, what do the 2024 UK and Ireland wind results mean for you?

2024 wind speed trends

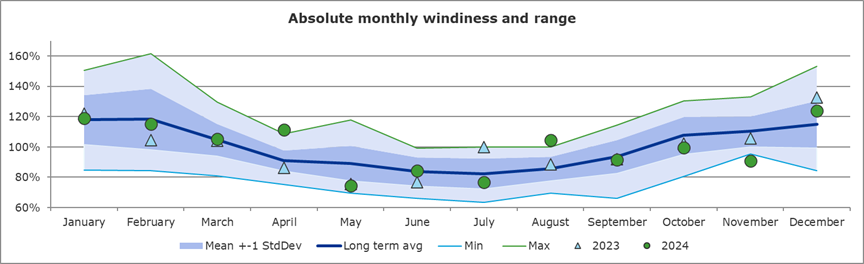
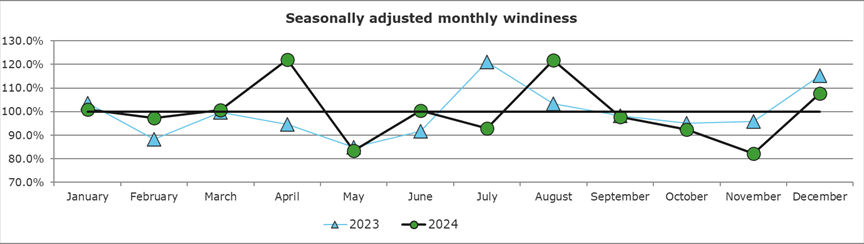
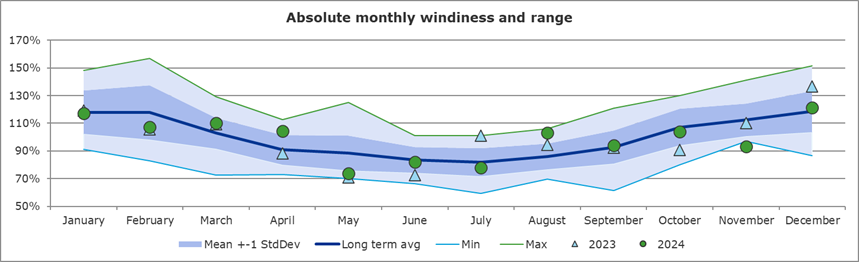
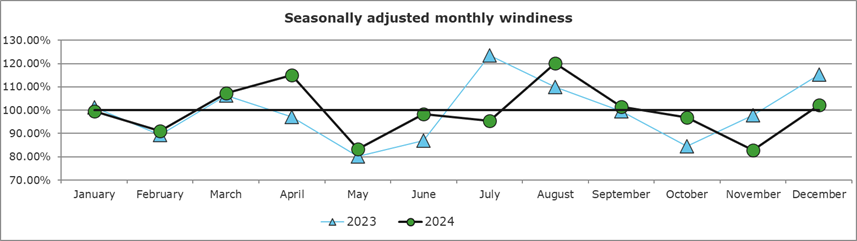
Across much of 2024 the windiness index followed a normal trend based on the seasonality of wind resource in the UK and Ireland. There were two months where the seasonally adjusted wind index deviated significantly from the normal trend – in April and August the UK experienced winds 22.2% and 21.9% higher than the long-term average, while in Ireland for those same months, winds were 15.1% and 20.2% higher than the long-term average. Most months would be considered normal and fall within the standard deviation of the long-term period. However, in the UK, April, May, August and November fall outside of the standard deviation, with weaker than normal winds in May (-25.5%) and November (-9.3%) and stronger than normal in April (+11.4%) and August (4.5%). In Ireland, winds were outside of the standard deviation in April (104.4%), May (73.7%), August (103.3%) and November (93.2%).

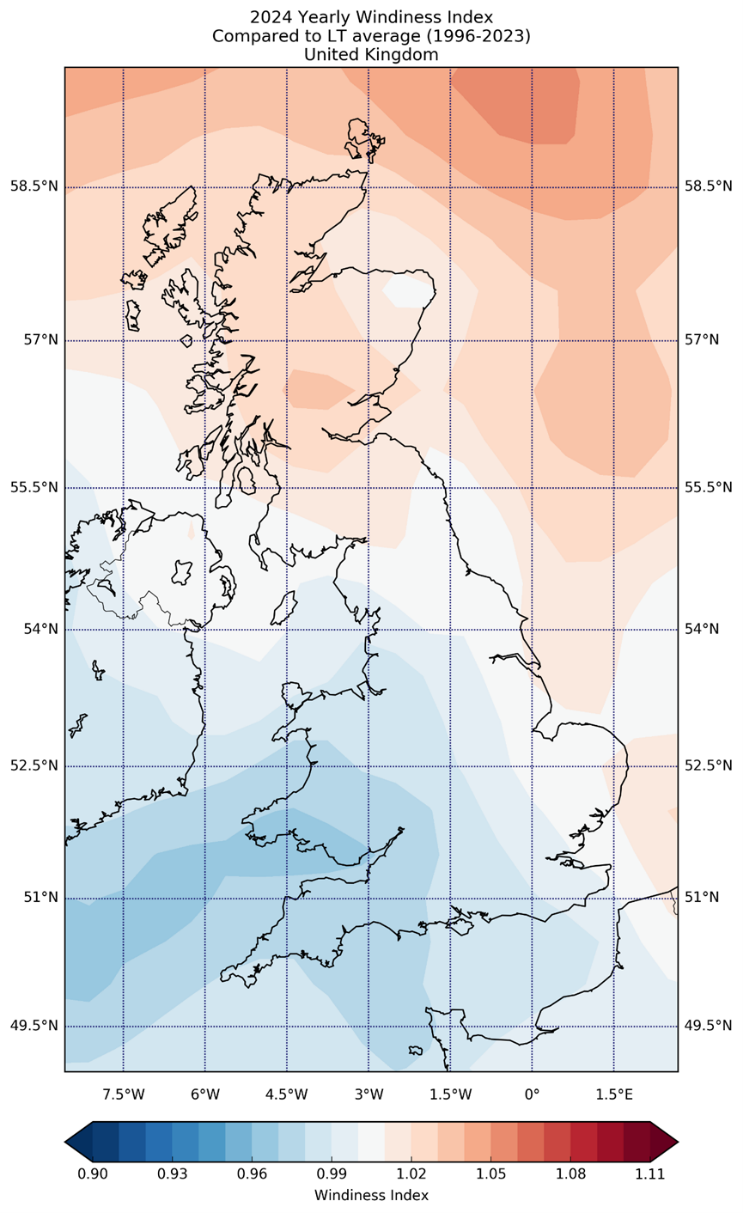
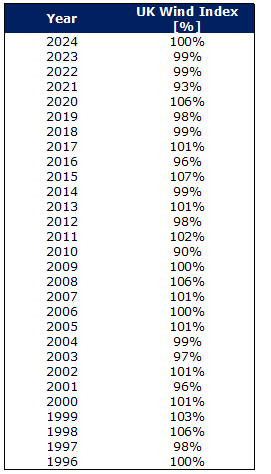
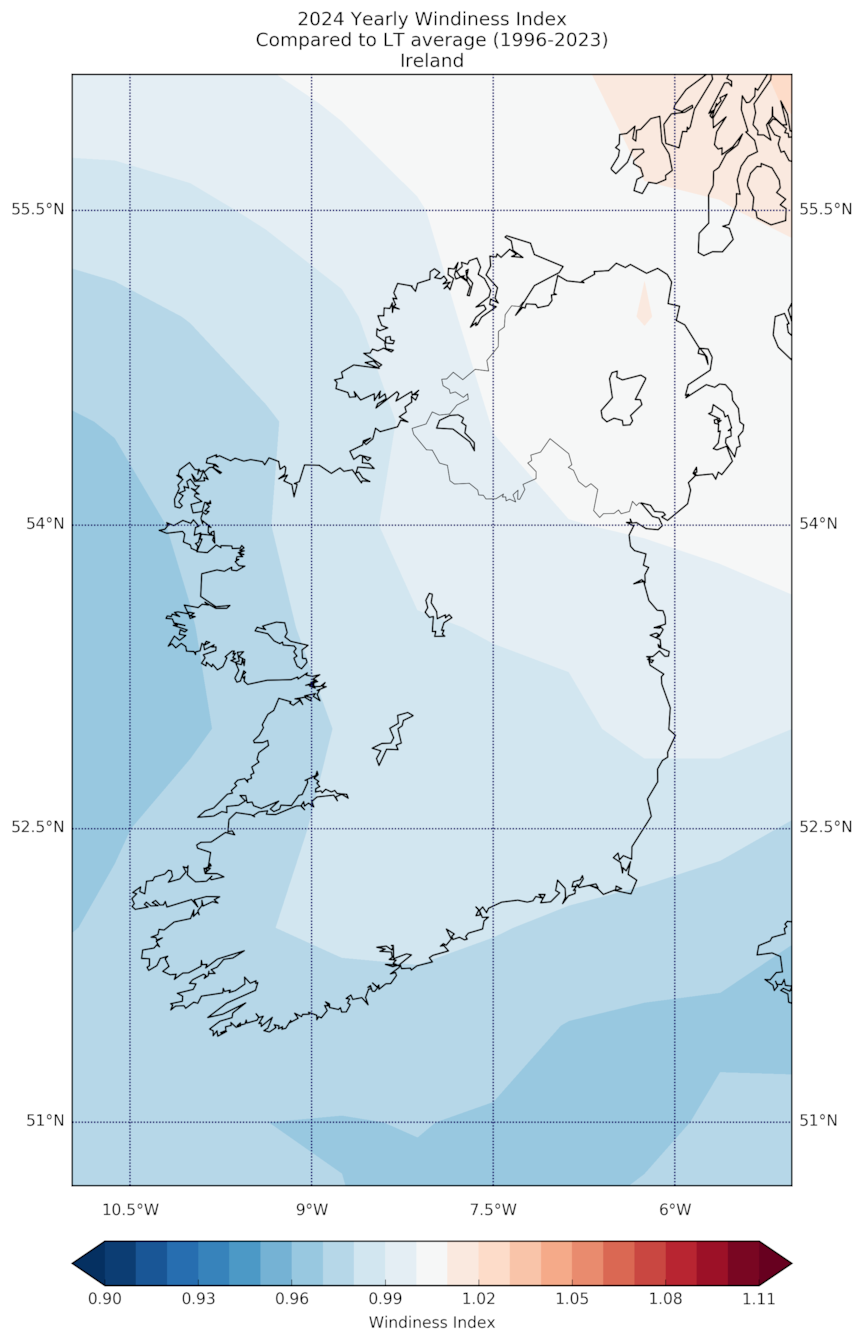
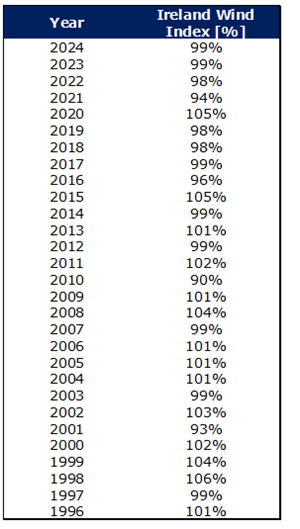
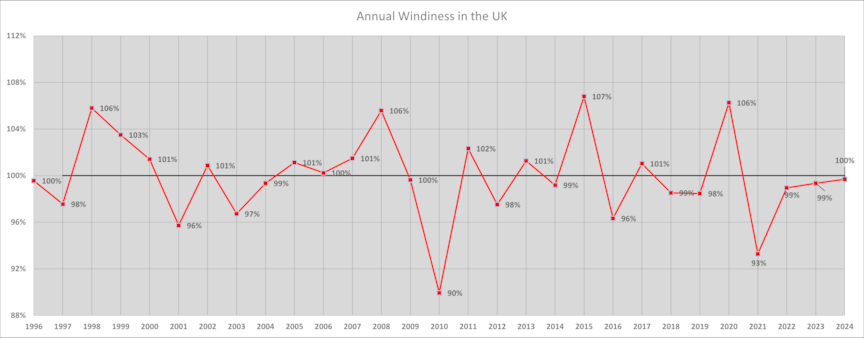
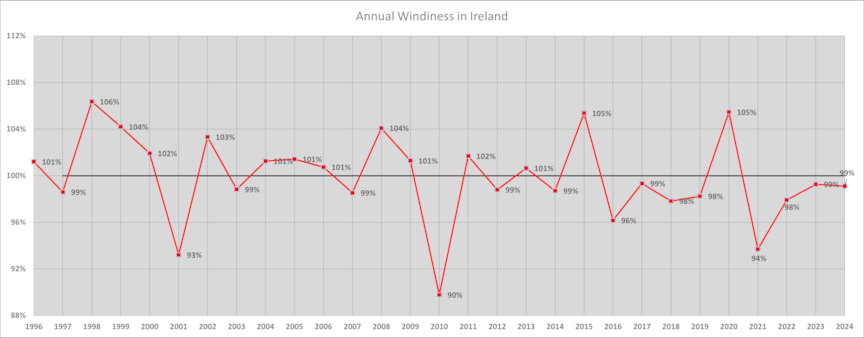
Overall, DNV’s Wind Index demonstrates that 2024 was less than 0.5% less windy on average for the UK (coming in at 99.7%) and Ireland was less than 1% less windy (coming in at 99.1%) than the 1996-2023 long-term reference. A full breakdown of the monthly and quarterly wind indices for 2024 is given in the tables below, along with the ‘windiness’ for each complete year in the index. For ease of referencing, the monthly index for 2023 is also shown.

Absolute monthly windiness and range UK

Seasonally adjusted monthly windiness UK


The year started with fractionally lower than average wind speeds for Q1 (Jan-Feb-Mar) in both the UK (-0.4%) and Ireland (-1%). In the UK this was largely due to lower-than-average wind speeds in February (-2.6%), while January and March experienced wind speeds in line with the long-term average (+0.9% and +0.7% respectively). In Ireland, Q1 was very similar to 2023 with lower-than-average wind speeds in January and February (-0.6% and –9% respectively), and March wind speeds were higher than the long-term average (+7.4%).

In both Ireland and the UK the wind speed index was significantly higher than the long-term average for April, with the seasonally adjusted windiness index sitting outside of 1 standard deviation in both regions. In the UK, wind speeds 22.2% higher than the long-term average were recorded while in Ireland they were 15.1% higher than average. There were multiple active weather fronts which led to these windy conditions, although the higher-than-average winds can largely be accounted to storm Kathleen in the first half of the month.

Similar to 2023, May experienced much lower than usual wind speeds in Ireland, 16.7% below the long-term mean and in the UK, 16.6% below. This was, in part, due to a period of high-pressure in the middle of the month. June wind speeds returned much closer to the long-term average in the UK (+0.5%), while Ireland experienced wind speeds 1.6% lower than the long-term average. Overall, the April-May-June (APJ) period had a positive deviation, 102.0% in the UK and a negative deviation 98.9% in Ireland.

Absolute monthly windiness and range IR

Seasonally adjusted monthly windiness IR

Wind resource in July was slightly lower than average, although they remained within one deviation for both Ireland (-4.5%) and the UK (-7.1%). In both Ireland and the UK, windspeeds for August 2024 were higher than usual, +20.2% and +21.9% respectively, and in the UK this was outside of the standard deviation and the highest windiness index since 1996. This was due to storm Lillian, the most significant storm to hit in the month of August since 2020. Winds for September were close to the long term in the UK (97.8 %) and in Ireland (101.5%). In Ireland, Q3 was the only quarter to have a positive seasonally adjusted wind index in 2024 (105.7%).

In the UK, October and November showed negative trends (-7.6% and –17.7% respectively). Similarly, In Ireland windspeeds were lower than the long-term average in October (+4%) and November (-17.2%).  Similar to December 2023, wind resource for both Ireland and the UK was stronger than normal levels in December 2024 (+2.3% and 7.7% respectively). Storm Darragh hit the UK and Ireland in December which alongside high pressure in the Atlantic caused stronger than normal winds for the region. As a quarter, Q4 came in as lower than the long-term mean, 94.5% in the UK and 94.3% in Ireland.

UK wind index 2024

Ireland wind index 2024

Regional variations

It is also important to consider the spatial distribution of the wind regime across the countries during the last year. Looking at the windiness maps for the UK below, we can observe that Q1 and Q2 spatial distribution was more uneven than Q3 and Q4. Q1 saw lighter winds in Wales, Scotland, Northern Ireland and the west of England, while the East of England saw slightly stronger than average winds. In Q2, much stronger than average winds were observed in the north of Scotland, while close to average wind speeds were observed the further south you travel. Slightly positive trends were observed for the UK throughout Q3, while in Q4 almost all of the UK, excluding Scotland, experienced negative trends.

2024 Yearly Windiness Index Compared to LT average (1996-2023) United Kingdom


UK wind index

Wind farms in all parts of Ireland had slightly lower wind speeds than usual in the first three months of the year and the last three months of the year, although the negative trend was stronger in the south of the country in Q4. However, in Q3 positive wind speed trends were observed throughout the Ireland with the strongest trends observed in the north and east of the country. For the year as a whole, trends were negative, although wind farms in the northeast would have experienced only slightly less wind than average.

2024 Yearly Windiness Index Compared to LT average (1996-2023) Ireland

Ireland wind index table


Long-term averages

For clarity, long-term graphs for both the UK and Ireland are shown to illustrate the fluctuation of windiness indices since 1996.

Annual windiness in the UK

Annual windiness in Ireland

Interpreting the data to establish an answer

Annual windiness remained lower than average in 2024, and was very similar to the windiness observed in 2023. What does this windiness index mean for wind farm owners, investors, and developers? All other things being equal, wind farm owners can expect to have seen slightly lower production at UK and Irish projects during 2024, compared to the long-term, because of the decreased windiness. Using typical project wind speed to energy sensitivity ratios, it is noted that a 2% drop in wind speed corresponds to a decrease of approximately 3-4% in terms of energy production. This should be taken into consideration during reviews of project performance. Investors will have seen similar energy productions in their wind projects when compared to 2023.

Wind farm developers who have been conducting wind measurements during 2024 can also expect the average wind speed to be slightly lower than the long-term average. This trend should be taken into consideration when adjusting measurements to be representative of a long-term period.

The UK and Irish wind indices

DNV maintains a UK and Ireland Wind Index, which enables owners and investors to assess the performance of potential or operating projects. Likewise, the Wind Index is a robust tool for wind farm developers, empowering them to understand the ‘windiness’ of their wind monitoring campaigns compared to a long-term period.

The long-term reference period represents all years between 1996 and the year prior to the analysis. The UK and Irish Wind Index is normalized so that the average wind speed over the long-term period is 100%. The windiness of any given period is expressed as a percentage of the long-term average wind speed. Thus, a value exceeding 100% indicates that a period was windier than the long-term average, whilst a value below 100% suggests that a period was less windy.

Seasonal effects

Wind speeds in the UK and Ireland exhibit strong seasonality, with a tendency for higher wind speeds during the winter months and lower wind speeds during the summer months. As a result, DNV also derives a seasonally adjusted Wind Index, which has been corrected for seasonal bias.

To be more precise, the windiness of any given period is expressed as a percentage of the long-term average wind speed for that specific period. For example, the long-term windiness of the month of January is 118%. If a specific (individual) January has an index value of 123%, the seasonally adjusted value for that January would be 123%/118% = 104% (+4%).

About DNV

DNV offers a new service for generating bespoke monthly Windiness Reports for your portfolio. This includes an average of your entire portfolio and a breakdown of each one of your assets. For more information, please contact Doireann Kavanagh. Learn more about our full range of services and products.

About Forecaster

Forecaster delivers insight into renewable energy supply and demand through reliable, data-driven predictions to help you maximize profits, avoid missed opportunities and optimize operations. Our proven methodology combines industry leading models from the world’s foremost meteorological agencies with an unparalleled understanding of renewable energy systems, plus cutting-edge statistical and physical models, machine learning and data analytics. As a result, our forecasts are globally renowned for accuracy and reliability.

Find out more about Forecaster here