Windiness 2024

What are the implications for you?

Following the wind speed analysis undertaken for the UK and Ireland, 
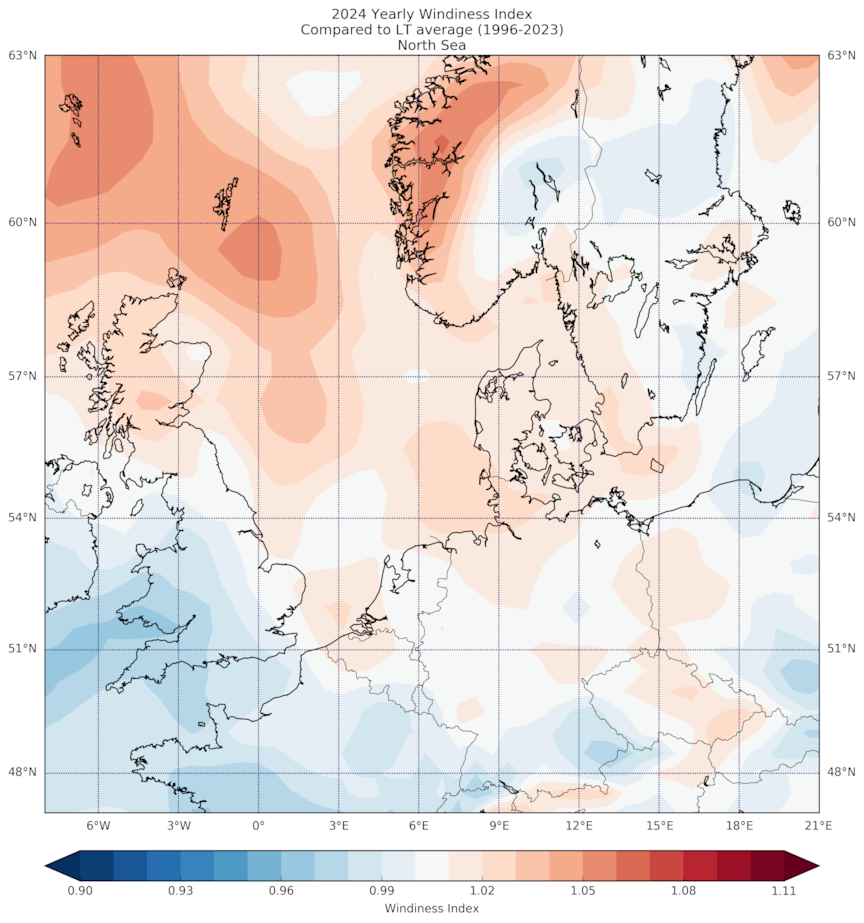
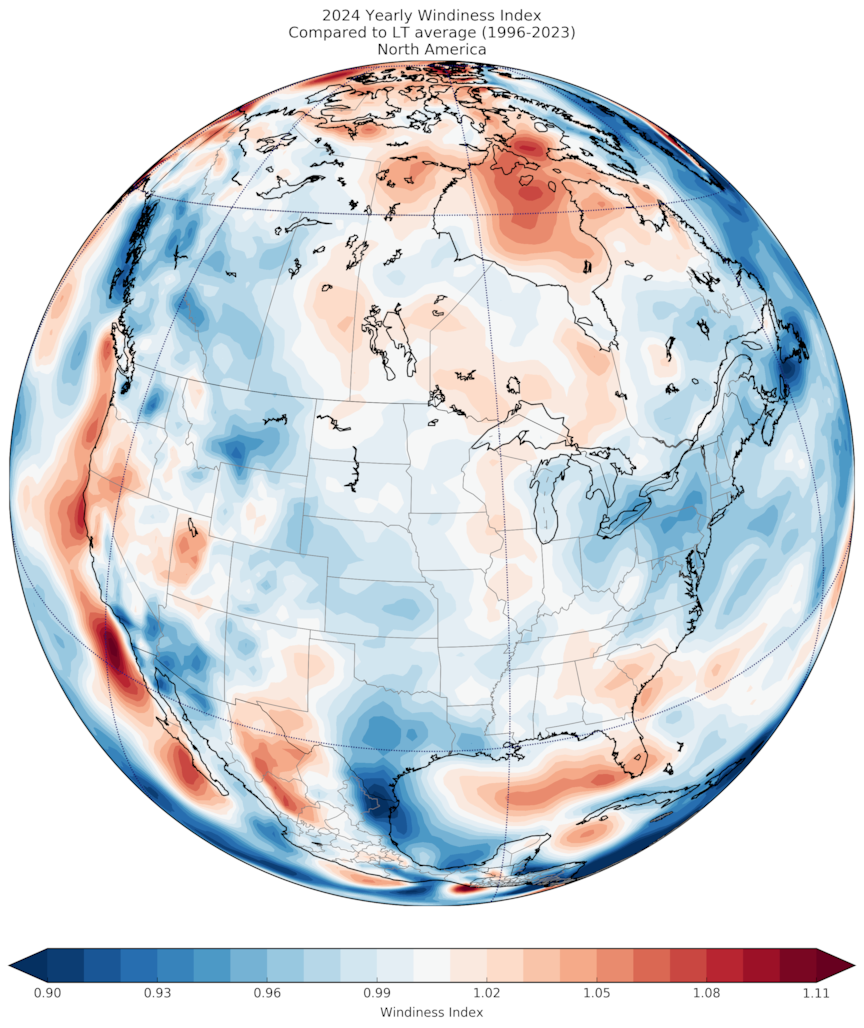
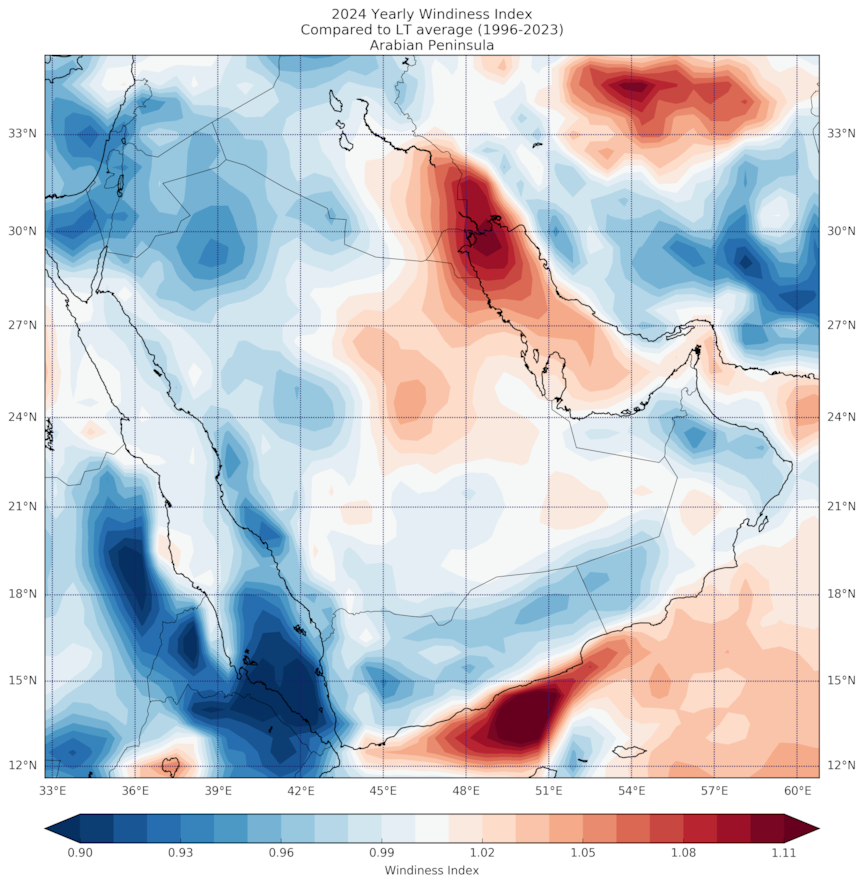
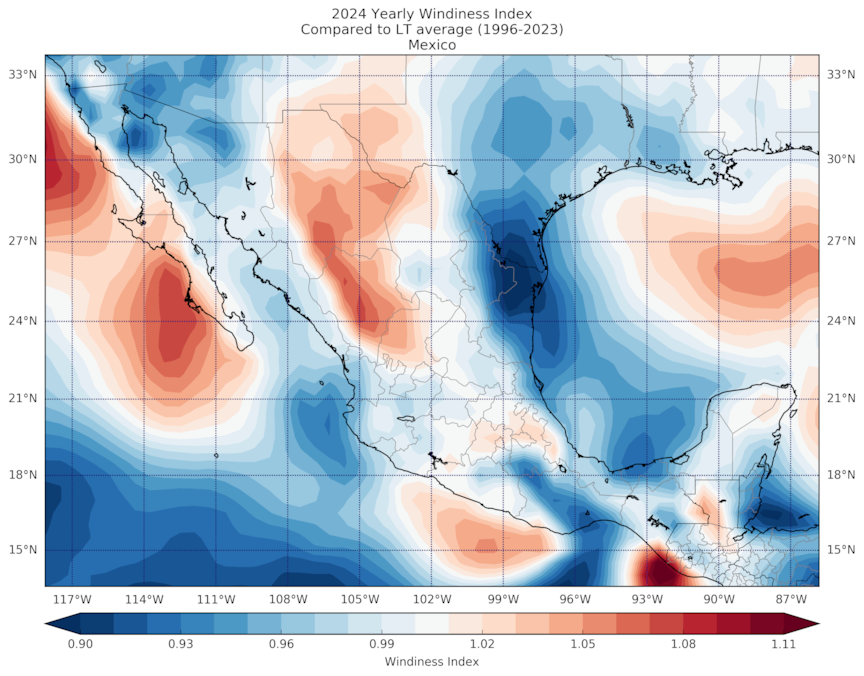
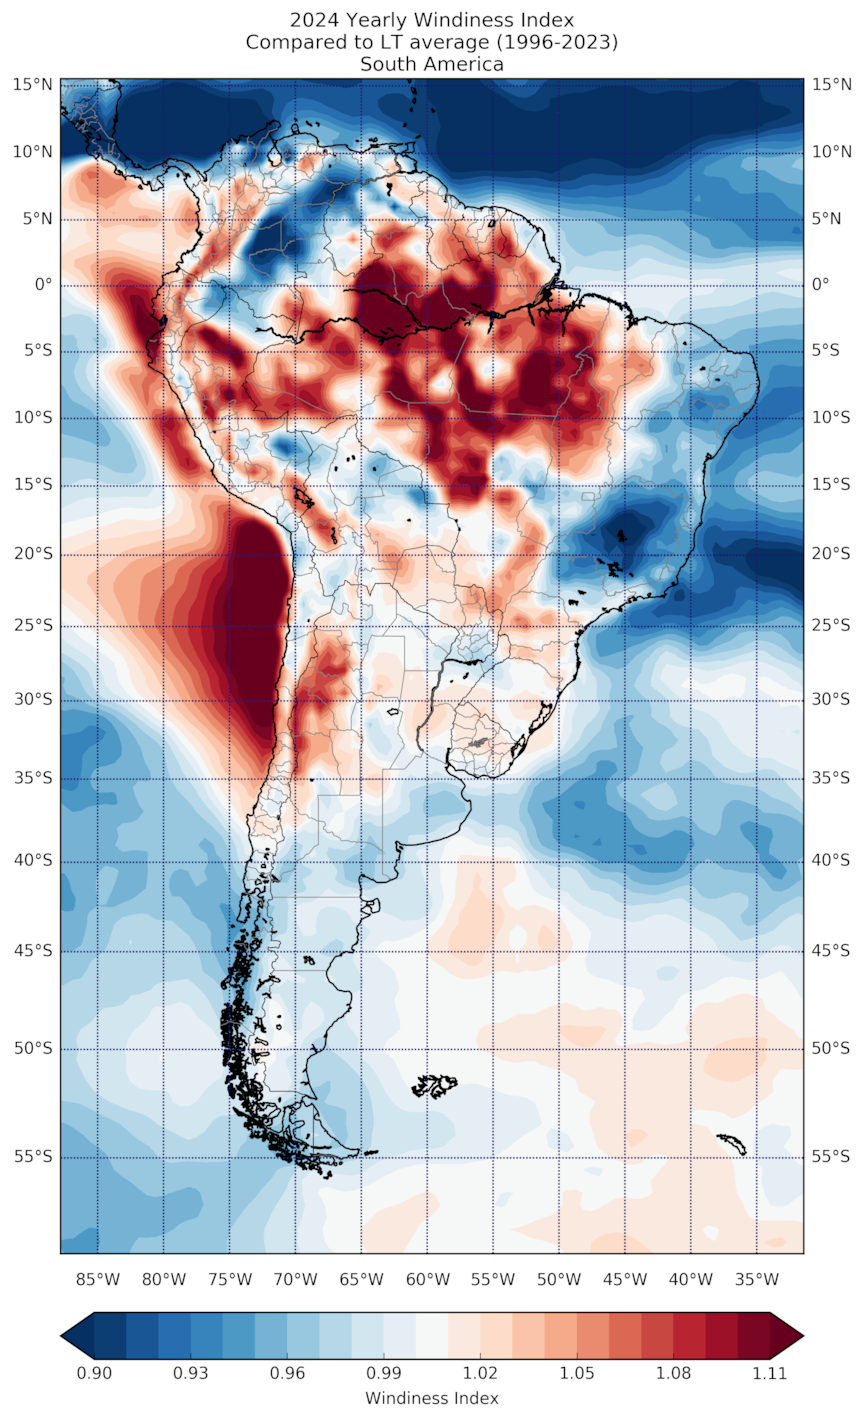
DNV has assessed the ‘windiness’ for various regions around the globe. We are using a common long-term reference period between 1996-2023 to assess the wind resource in 2024 for consistency across each region. It is noted that for a more thorough assessment at a country-level, the consistency of the data making up the index for each country should be investigated.

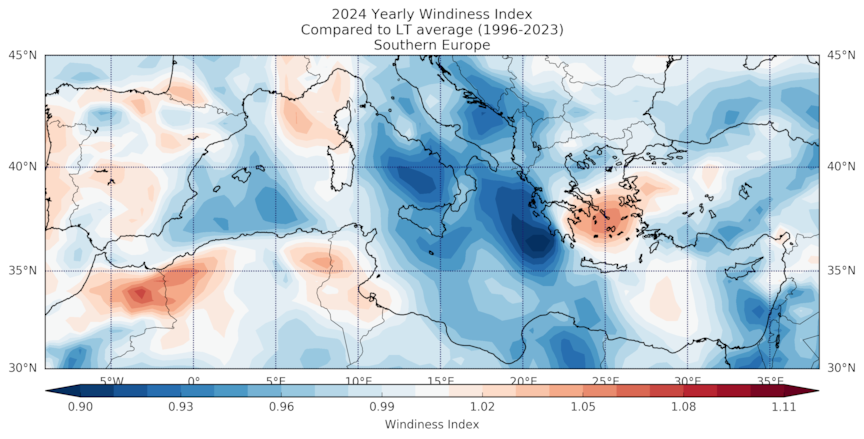
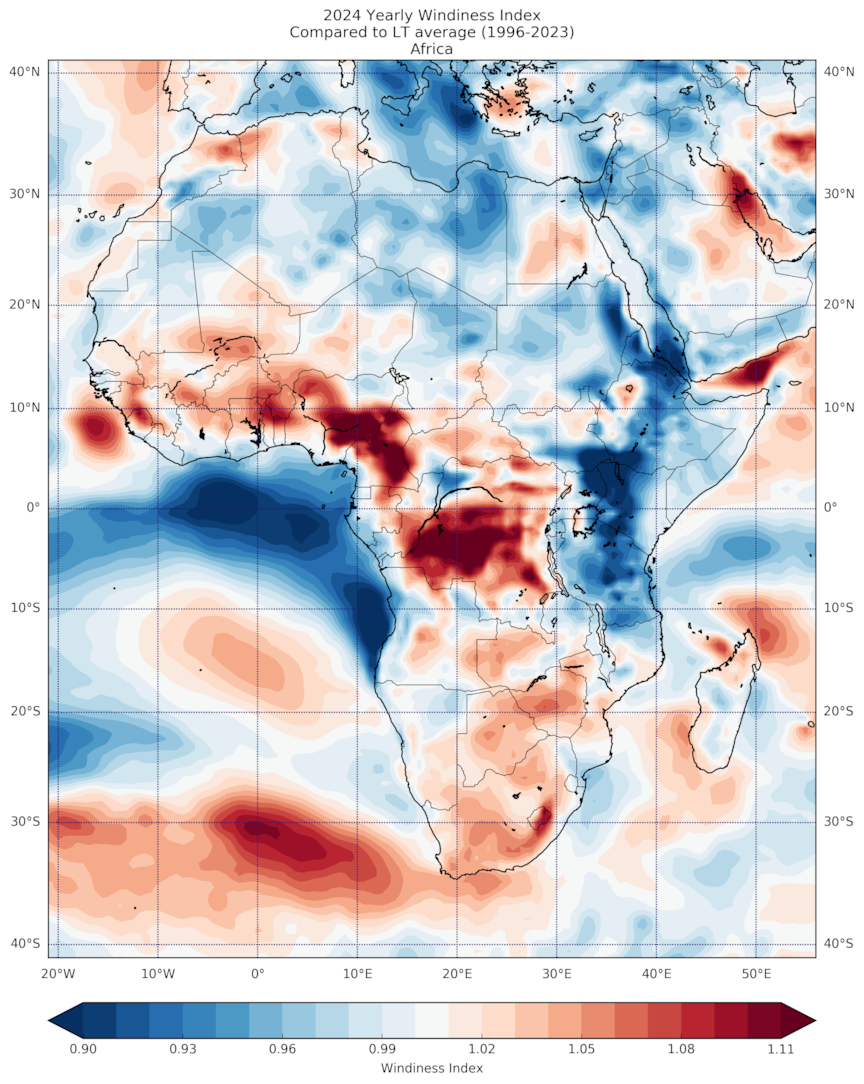
Below we present the Annual Windiness Indices for these regions, which represent the wind speed snapshot of 2024 against the long-term mean wind speed.

Southern Europe wind speed trends

Southern Europe’s windiness trends show significant variability with key differences between the first and second half of the year. A considerable drop in windiness off the southwest coast of Greece indicates a 10% reduction compared to the long-term average. However, in the Aegean, index values peak around 5% above the average.

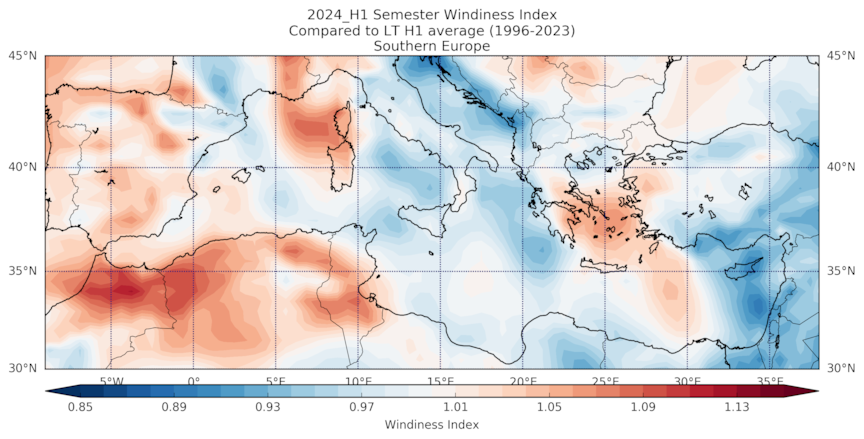
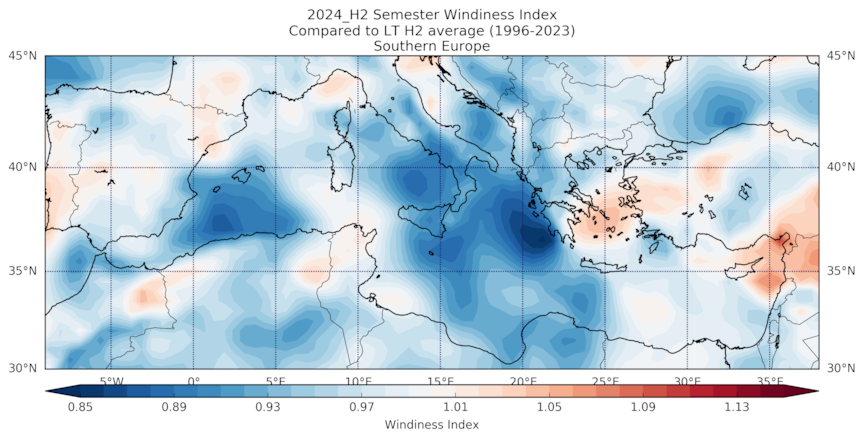
Inspecting the trends between the first and second half of the year, higher windiness trends persisted in the Aegean. The reduced windiness patterns off the coast of Greece was prominent during the second half of the year which could indicate its anomalous nature. Higher wind trends in Spain and the southern coast of France were prominent in the first half of the year but absent in the second.


2023 Yearly Windiness Index Compared to LT average (1996-2022) Southern Europe

2023_H1 Semester Windiness Index Compared to LT H1 average (1996-2022) Southern Europe

2023_H2 Semester Windiness Index Compared to LT H2 average (1996-2022) Southern Europe

North Sea (Benelux, Scandinavia and Baltics) wind speed trends

The North Sea region has seen a reversal in windiness trends based on previous years. The Faroe Islands, Shetland Islands, and the sout-west coast of Norway have seen higher wind trends with index values reaching 6% above the long-term averge. The remaining areas have not seen any significant flux in windiness tendency.

A noteable shift in windiness can be observed from the first half to the second half of the year. The coast of Norway and the entirety of the North Sea were considerably more windy with index values peaking at 10% above normal. The mainland European areas have also seen stronger wind trends.

The second half of the year experienced an inverse shift in trends. The North Sea and mainland Europe underwent a reduction in windiness with index values reduced by about 5%. The higher wind trends on the coast of Norway shifted east of the Scandinavia Mountains reaching across Sweden to the Gulf of Bothnia.

2023 Yearly Windiness Index Compared to LT average (1996-2022) North Sea


North America wind speed trends

Higher wind trends have been observed along the east and west coasts of North America with some variability inland. Canada’s windiness increased in the Hudson Bay and Northwestern Passages as well as a reduction on the east and west coasts. The United States experienced an above average year for windiness all along the west coast with a concentration near the Channel Islands of California with index values exceeding 11%. A linear concentration of high wind speeds can also be observed on the south coast of the United States reaching Florida which could be indicative of the active hurricane season in the past year.

The first half of the year was responsible for the drastically lower wind conditions on the Canadian west coast as well as the higher wind trends along the United States west coast. The Gulf of Mexico encountered strong winds in the first half of the year considering index values were 8% higher than the long-term average.

The second half of the year exposes a windy concentration in the northern Canadian territories and through the Northwest Passage with an increased index of 12%. The concentrated windy region off the Californian coast and around the Floridian areas should be noted as a consistent trend throughout the year.

2023 Yearly Windiness Index Compared to LT average (1996-2022) North America

Middle East (Near East and Arabian Peninsula) wind speed trends

Substantial transitions in wind trends occurred over the last year in the Middle East. Particularly, in the south of the Red Sea, winds were significantly lower with a decrease of over 10% compared to the long-term average. Just around the corner, the south coast of Yemen experienced windiness trends 11% above normal. The border junction of Iran, Iraq, and Kuwait similarly faced higher concentration of windiness with index values around 8% above normal.

The strong anomalous trends were prominent in the latter half of the year compared to the first half. The trends are consistent between both halves; however, the magnitude is higher in the latter half, especially for the Persian Gulf where index values were around 13%.

2023 Yearly Windiness Index Compared to LT average (1996-2022) Arabian Peninsula

Central and South America wind speed trends

For Central and South America, we see a large range of windiness index. However, if we focus on the regions where wind plants are installed, we observe that the windiness index is below 1 for most regions, with a few exceptions.

Uruguay's wind plants located mostly at the south of the territory will have experienced above average wind speeds for the first half of the year, however for the second half of the year wind speeds were slightly below average bringing the average very close to 1.

Other regions like Brazil had a less windy year as compared to the long-term wind speed expectations with a windiness index less than 1 for the entire year.

2023 Yearly Windiness Index Compared to LT average (1996-2022) Mexico

Mexico’s wind energy sector has experienced significant shifts in recent years, influenced by changing administrations and regulatory frameworks. In addition to the political climate Mexico shows a below 1 windiness index in most regions. This means that the sector is likely to have produced below expectations over the entire year, potentially adding further concerns for developers and operators.

A stronger > 1 windiness index was observed for the first half of the year between the Sierra Madres. This trend continued for the second half of the year. Unfortunately, not many wind farms benefited from this excess wind since there are not many turbines installed in the region.

Wind Farms in El Bajío experienced very typical wind speeds over the entire year. Plants like La Bufa in Zacatecas and the recently commissioned San Pedro in Querétaro should have had a very typical year.

2023 Yearly Windiness Index Compared to LT average (1996-2022) South America

Africa wind speed trends

Africa generally experiences normal wind speed trends around the equatorial countries due to the general atmospheric circulation and the easterly winds. While in its northern and southern regions, westerly winds are usually predominant. In most parts of Africa, trade winds are responsible for constant high surface mean speeds of 10 m/s which make the region very suitable for wind energy developments. In this section, we will look at the African countries where large wind farms are already in operation, such as Kenya, South Africa, Morocco, and Egypt.

Kenya, home of Lake Turkana, the largest wind farm in Africa, experienced lower than average wind speeds over the entire year.

2023 Yearly Windiness Index Compared to LT average (1996-2022) Africa

Windiness Index over South Africa, where a large number of turbines are located, experienced higher than average wind speeds as indicated with the >1 windiness index. A trend that continued from last year. Checkout Windiness 2023 global for more details about 2023 results.

2023 Yearly Windiness Index Compared to LT average (1996-2022) South Africa

DNV's Wind Index

DNV maintains multiple Wind Indexes for various countries and regions, which enable investors and owners to assess the performance of potential or operating projects. The Wind Index is also a robust tool for wind farm developers, empowering them to understand the ‘windiness’ of their wind monitoring campaigns compared to a long-term period.

The long-term reference period represents all years between 1996 and the year prior to the analysis. The Wind Index is normalized so that the average wind speed over the long-term period is 100%. The windiness of any given period is expressed as a percentage of the long-term average wind speed. Thus, a value exceeding 100% (or 1) indicates that a period was windier than the long-term average, whilst a value below 100% (or 1) suggests that a period was less windy.

About Forecaster 

Forecaster delivers insight into renewable energy supply and demand through reliable, data-driven predictions to help you maximize profits, avoid missed opportunities and optimize operations. Our proven methodology combines industry leading models from the world’s foremost meteorological agencies with an unparalleled understanding of renewable energy systems, plus cutting-edge statistical and physical models, machine learning and data analytics. As a result, our forecasts are globally renowned for accuracy and reliability.  

Find out more about Forecaster here.


About DNV

DNV offers a new service for generating bespoke monthly Windiness Reports for your portfolio. This includes an average of your entire portfolio and a breakdown of each one of your assets. For more information, please contact Alex Brisbois or Ricardo Zetina Benignos.

Learn more about our full range of services and products.