What do the 2023 results mean for you?
Monitoring and recording wind speed trends can provide valuable insights for assessing project performance. But interpreting, understanding, and acting on those trends is where the real value lies. So, what do the 2023 UK and Ireland wind results mean for you?
2023 wind speed trends
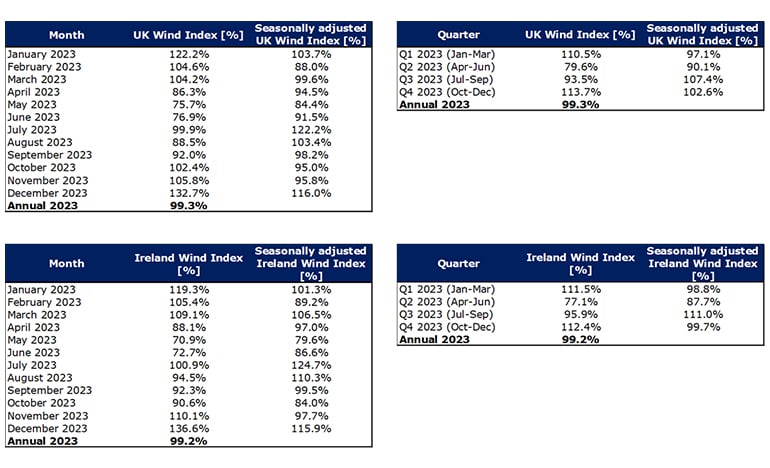
The windiness index followed a generally normal trend across 2023 based on the seasonality of wind resource in the UK and Ireland, except for in the month of July when winds were 22.2% higher than the long-term average in the UK and 24.7% in Ireland. Most months would be considered normal and fall within the standard deviation of the long-term period. However, in the UK, May and December fall outside of the standard deviation, with weaker than normal winds in May (-15.6%) and stronger than normal in December (+16%). In Ireland, winds were outside of the standard deviation in May (79.6%), June (86.6%), October (84.0%) and December (115.9%).
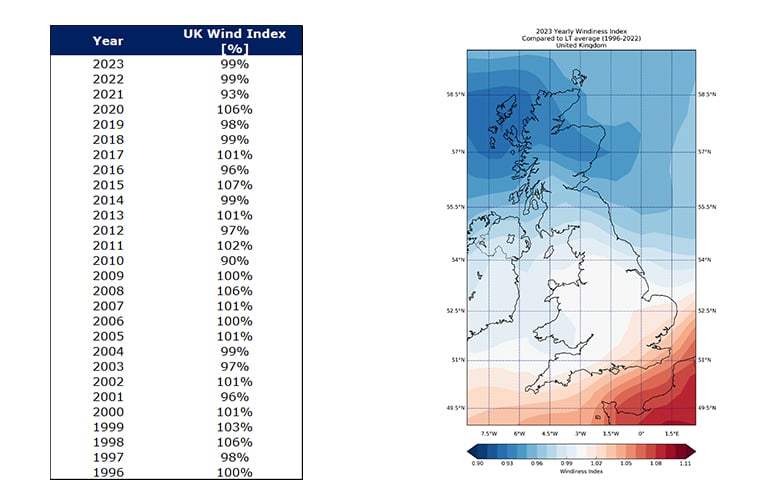
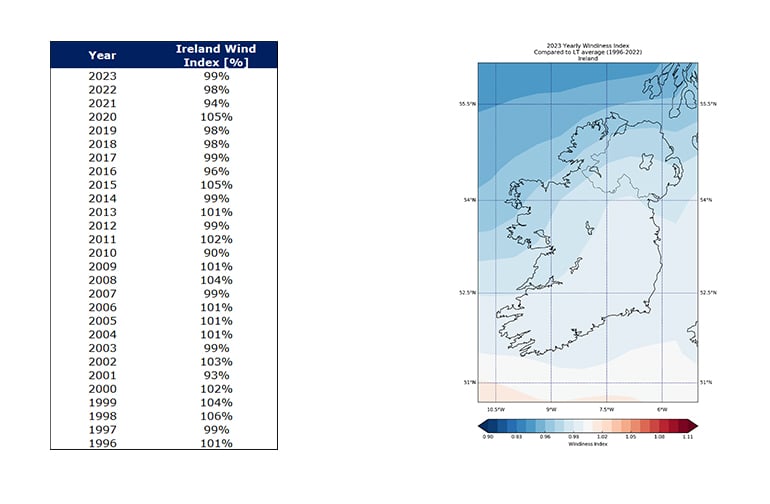
Overall, DNV’s Wind Index demonstrates that 2023 was approximately 1% less windy on average for the UK (coming in at 99.3%) and Ireland (coming in at 99.2%) than the 1996-2022 long-term reference. A full breakdown of the monthly and quarterly wind indices for 2023 is given in the tables below, along with the ‘windiness’ for each complete year in the index. For ease of referencing, the monthly index for 2022 is also shown.
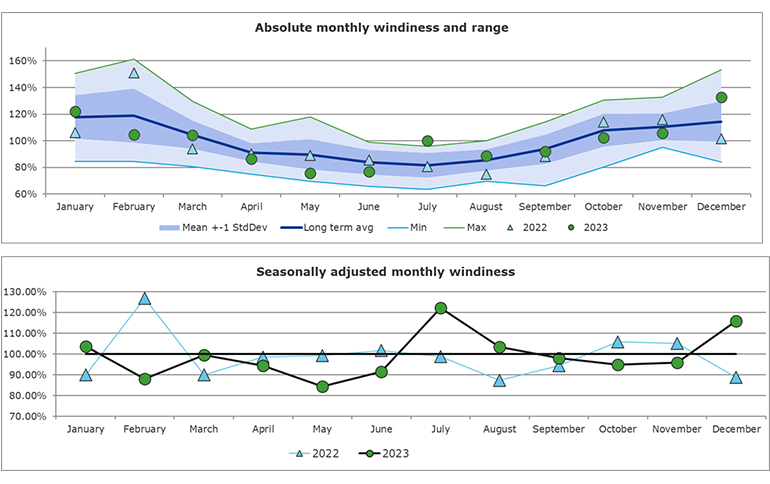
The year started with slightly above average wind speeds in January, 3.7% higher than the long-term in the UK, while windspeeds were very similar to the long-term average in Ireland, only 1.3% higher than the long-term mean. This is up from the lower-than-average wind speeds we saw in Ireland and the UK in January 2022.
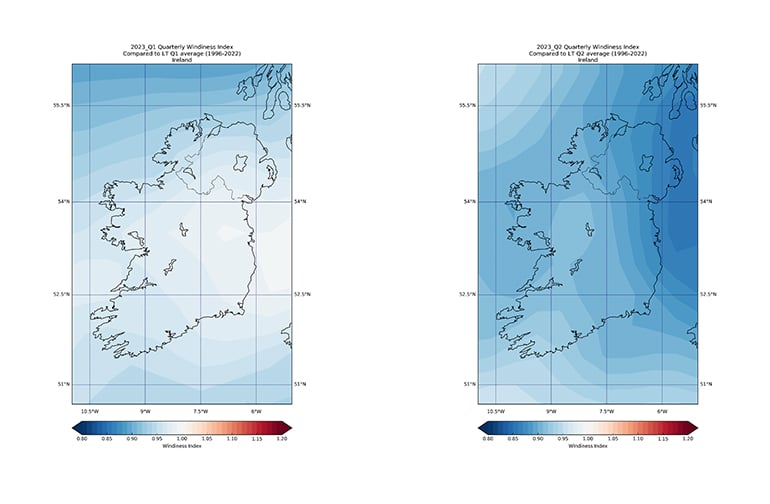
Wind resource in February was slightly lower than average, although they remained within one deviation for both Ireland and the UK. March wind speeds in the UK were very close to the long-term average (-0.4%), while Ireland experienced wind speeds 6.5% higher than normal. Overall, the January-February-March (JFM) period had a negative deviation, 97.1% in the UK and 98.8% in Ireland.
During April -May-June (AMJ) of 2023, wind speeds were lower than usual in every month with winds down 9.9% in the UK and 12.3% in Ireland for the period as a whole. May experienced much lower than usual wind speeds in Ireland, 20.4% below the long-term mean and in the UK, 15.6% below. This was largely due to a long period of anticyclonic weather in the second half of the month.
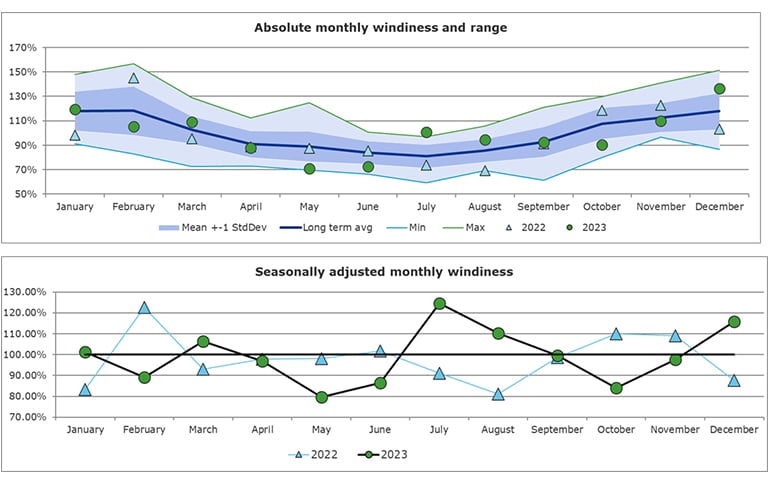
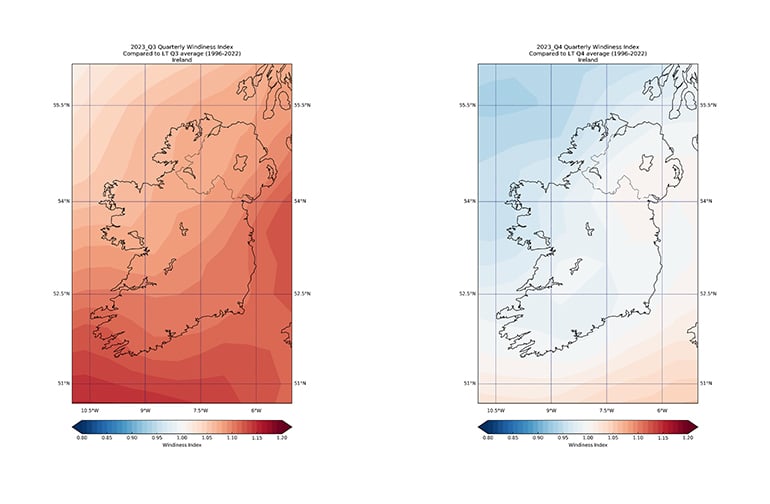
In both Ireland and the UK, windspeeds for July 2023 were significantly higher than usual, +24.7% and +22.2% respectively, both outside of the standard deviation. This was due to a number of frontal systems pushing in from the southwest as a result of the jet stream being further south than usual. Ireland continued to experience above average wind speeds in August (110.3%), while in September, windspeeds were very close to the long-term mean (99.5%). Winds for August and September were close to the long term in the UK (103.4 % and 98.2% respectively). In Ireland, Q3 was the only quarter to have a positive seasonally adjusted wind index in 2023 (111.0%).
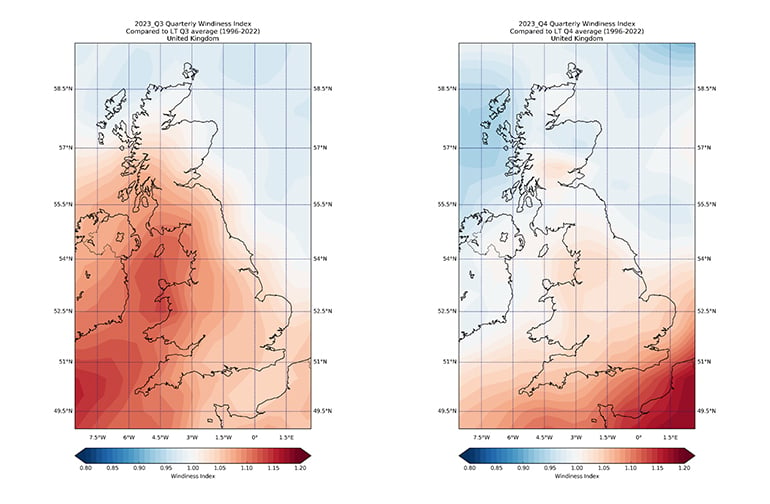
In the UK, October and November experienced slightly negative trends (-5% and -4.2% respectively) although both months were very close to the long-term average. Similarly in Ireland windspeeds were lower than usual and close to the long-term average in November (-2.3%). However, Ireland experienced a significant negative trend in October, 16.0% below the long-term average. In contrast to the dip in average wind speeds in December 2022, wind resource for both Ireland and the UK was slightly stronger than normal levels in December 2023 (+15.9% and 16.0% respectively). Three storms hit the UK and Ireland in December – Elin, Fergus and Gerrit which caused stronger than normal winds for the region. As a quarter, Q4 came in as a very close to the long-term mean, 102.6% in the UK and 99.7% in Ireland.
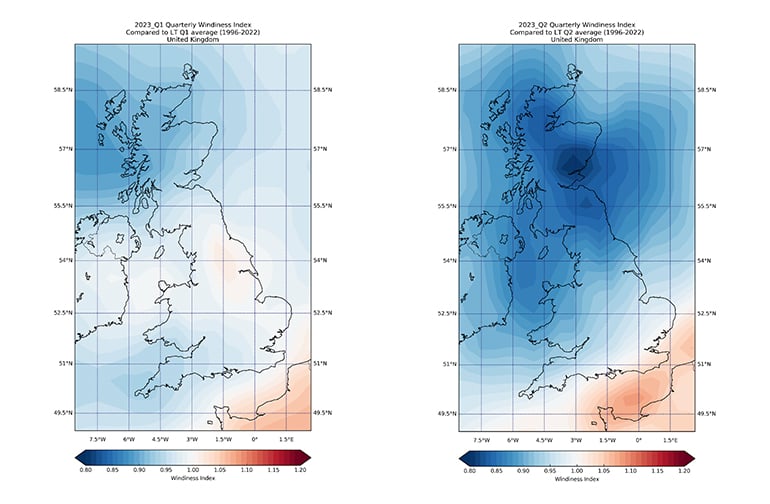
Regional variations
It is also important to consider the spatial distribution of the wind regime across the countries during the last year. Looking at the windiness maps for the UK below, we can observe that the north of Scotland experienced negative trends for the year, while wind farms in the southeast of England experienced slightly stronger than normal winds throughout the year. Wind farms in all parts of the UK had slightly lower wind speeds than usual in the first six months of the year with the exception of some parts of England where slightly higher than normal wind speeds were observed. However, in the second six months of the year higher wind speeds were observed throughout the UK except for small parts of Scotland and Northern Ireland.
In Ireland, it can be observed that in the first six months of the year, the country experienced negative trends, with slightly stronger negative trends in AMJ. In the third quarter the entire country saw positive trends, particularly in the south and east of the country. Wind farms in the northeast of Ireland observed a slight positive deviation in the final quarter of the year, while the remainder of the country experienced a slight negative deviation.
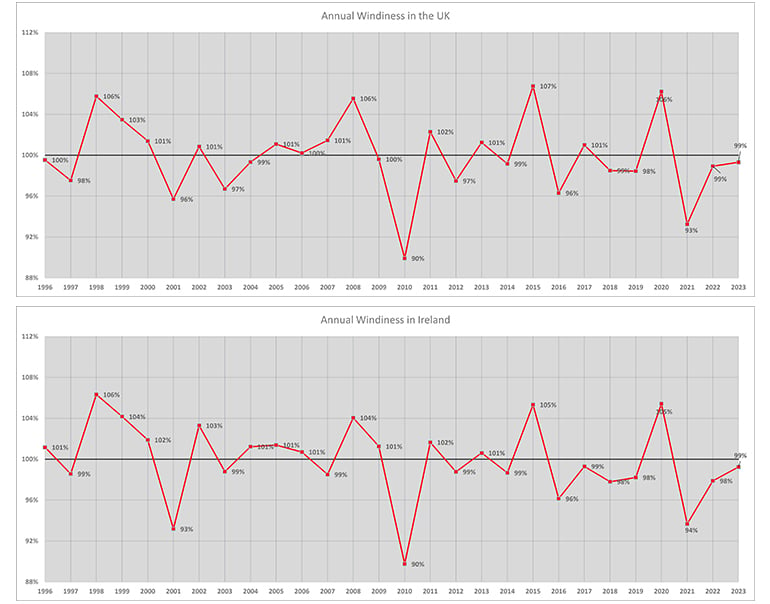
Long-term averages
For clarity, long term graphs for both the UK and Ireland are shown to illustrate the fluctuation of windiness indices since 1996.
Interpreting the data to establish an answer
Annual windiness remained lower than average in 2023, and was very similar to the windiness observed in 2022. What does this windiness index mean for wind farm owners, investors, and developers? All other things being equal, wind farm owners can expect to have seen slightly lower production at UK and Irish projects during 2023, compared to the long-term, because of the decreased windiness. Using typical project wind speed to energy sensitivity ratios, it is noted that a 2% drop in wind speed corresponds to a decrease of approximately 3-4% in terms of energy production. This should be taken into consideration during reviews of project performance. Investors will have seen slightly higher energy productions in their wind projects when compared to 2022. This is mainly due to higher wind resources in February and wind resources closer to the long-term average in Q3 & Q4 in the UK and Q3 in Ireland.
Wind farm developers who have been conducting wind measurements during 2023 can also expect the average wind speed to be lower than the long-term average This trend should be taken into consideration when adjusting measurements to be representative of a long-term period.
The UK and Irish Wind Indices
DNV maintains a UK and Ireland Wind Index, which enables owners and investors to assess the performance of potential or operating projects. Likewise, the Wind Index is a robust tool for wind farm developers, empowering them to understand the ‘windiness’ of their wind monitoring campaigns compared to a long-term period.
The long-term reference period represents all years between 1996 and the year prior to the analysis. The UK and Irish Wind Index is normalized so that the average wind speed over the long-term period is 100%. The windiness of any given period is expressed as a percentage of the long-term average wind speed. Thus, a value exceeding 100% indicates that a period was windier than the long-term average, whilst a value below 100% suggests that a period was less windy.
Seasonal effects
Wind speeds in the UK and Ireland exhibit strong seasonality, with a tendency for higher wind speeds during the winter months and lower wind speeds during the summer months. As a result, DNV also derives a seasonally adjusted Wind Index, which has been corrected for seasonal bias.
To be more precise, the windiness of any given period is expressed as a percentage of the long-term average wind speed for that specific period. For example, the long-term windiness of the month of January is 118%. If a specific (individual) January has an index value of 123%, the seasonally adjusted value for that January would be 123%/118% = 104% (+4%).
About DNV
DNV offers a new service for generating bespoke monthly Windiness Reports for your portfolio. This includes an average of your entire portfolio and a breakdown of each one of your assets. For more information, please contact Doireann Kavanagh.
Learn more about our full range of services and products.
Contact us

