When will electrified household energy services become the new normal?

Decarbonising household energy services is one of the biggest challenges the UK is facing along its pathway to net zero. The decarbonisation solution that is considered most suitable for the majority of households is direct electrification. This blog examines how likely it is that electrification targets in residential buildings and transport will be achieved between now and 2050.
Introduction
Five key uncertainties are identified as potential game changers for household electrification: societal responses to technologies; supply chain responses to policies; power supply and distribution changes; suitability of homes for heat pumps; and the price of electricity. Each will influence the anticipated technology learning and rate of adoption by the public in different ways. Notwithstanding these uncertainties, there is enough ambition and industrial capacity for the UK to achieve close to complete decarbonisation of household energy by 2050. With the right kind of governance and policy, innovation in manufacturing and the energy sector, and public willingness to adapt and change, we see real world progress being much faster than a business-as-usual forecast.
The challenge
Two subsectors dominate the decarbonisation challenge in household energy services: domestic building heat and passenger road transport.
| Domestic building heat (space, water, and cooking) | Passenger road transport (cars, taxis, minibuses) | |
| Percentage of total UK final energy demand1 | 18% | 16% |
| Percentage of total UK CO2e emissions2 | 14% | 16% |
| Total share of UK as households | 32% | 32% |
The key technology options for direct electrification of heating are air source heat pumps (ASHP) and ground source heat pumps (GSHP). For transport, technology options are electrified public transport, battery electric vehicles (BEVs) and plug-in electric vehicles (PHEVs). The Climate Change Committee (CCC) expects that by 2035, 50% of heat demand in buildings will be met by low-carbon sources (predominantly ASHPs), rising to 99% by 2050; and they expect that after 2035 all new heating installations will be low-carbon.3 The 2023 Heat Pump Investment Roadmap envisages the number of annual heat pump installations will increase from 55,000 in 2021 to 600,000 by 2028.4
There is a similar plan for household vehicles. The 2021 Department for Transport decarbonisation plan includes ending the sale of new petrol or diesel cars by 2030, and all new cars being 100% zero tailpipe emissions vehicles (ZEVs) by 2035.5 This is supported by the 2023 ZEV mandate, which requires 22% of new cars sold in 2024 to be ZEV, rising each year to reach 100% by 2035.6 In the CCC milestones, the share of the UK car fleet as ZEVs will be 64% by 2035, 86% by 2040, and 99% by 2050; and the average emissions intensity of cars will decrease dramatically, reaching 75.7 gCO2/km by 2030, 35 gCO2/km by 2035 and only 0.05 gCO2/km by 2050.7
It is clear that the size of the ambition of household electrification is tremendous. There are almost 30 million registered cars on the road today across the UK and only 2.2% of them are EVs or PHEVs;8 and of the 28.3 million households in the UK, only 8% currently use electric-only heating (with some of that share being low-efficiency electric resistance heat).
Why electrification?
Electrification has the following benefits and drawbacks for building heat and passenger transport:
- More useful energy:
For passenger road transport: electric (BEVs) or part-electric (PHEVs) are on average around three times more fuel efficient than combustion vehicles, providing more useful energy9 for each unit of primary energy.10
For heating: Figure 1 compares the efficiency of different space heating technologies while taking into account their different efficiencies, conversions, and energy losses. For every 100 units of primary energy supplied, a heating system relying on heat pumps can raise the useful energy delivered to 177 units, considering the UK’s current power generation mix. Heat pumps can provide more than twice the useful energy than natural gas boilers.
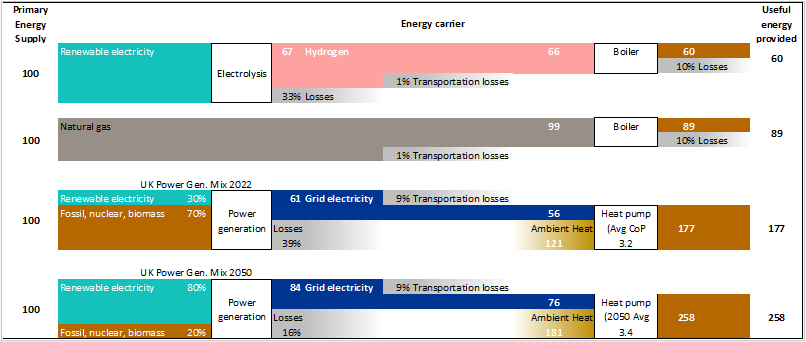
Figure 1: Primary and useful energy comparison for different energy carriers and heating equipment11 - Easier to decarbonise: Electricity is far easier and cheaper to decarbonise than energy carriers in gaseous or liquid forms, because most renewable and low-carbon energy sources such as wind and nuclear power produce electricity. Not converting electricity into another type of energy carrier saves the energy that is needed to do the conversion – up to 50% for hydrogen, and 3-5 times more for e-fuels.12
- Helps achieve energy security: Making the most of the large potential for domestic generation of electricity from renewables, such as wind and solar, will reduce the vulnerability to price rises in international energy markets and improve the UK’s energy security.
- More potential: Electricity is the energy carrier with the largest potential for growth. While biogas and biomass are alternatives that provide lower carbon energy compared to fossil fuels, their availability is limited in the UK.
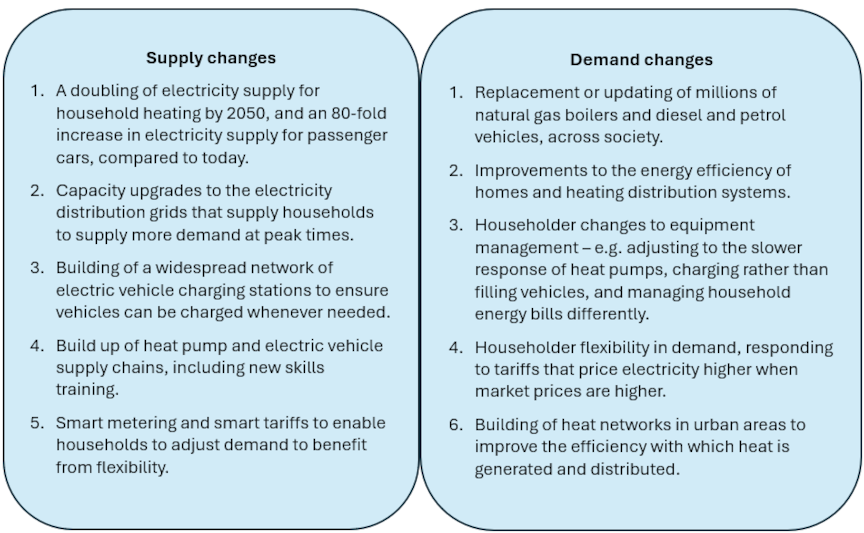
What changes need to happen
Changes are required in both supply and demand to achieve electrification of the over 90% of final energy demand for household energy services that is currently consumed as fossil fuels.
Progress and forecasts to 2050
Household heating
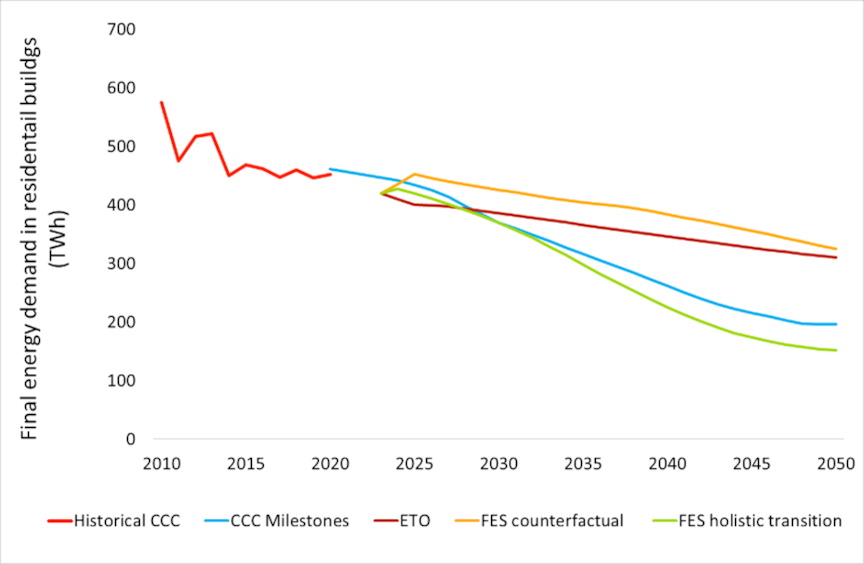
There is a large amount of untapped potential for energy efficiency improvements in UK housing. A quarter of energy currently used in UK housing could be cost-effectively saved by 2035, and in theory this saving could be increased to up to a half.13 Benefits for households include reducing energy bills, improved health, and better levels of comfort. There has been progress on home efficiency; in England, the percentage of homes with an energy efficiency rating of band C or higher increased from 12% in 2010 to 48% in 2022.14 The government has set a target for all fuel-poor homes to be at least band C by 2030. Total energy demand in homes has been steadily decreasing since 2010. CCC future milestones show energy demand falling to 57% of the 2020 level by 2050. DNV’s Energy Transition Outlook forecasts demand reductions of only a quarter by 2050 compared to 2010, however.
Figure 2 shows a comparison of final energy demand in residential buildings from different sources: CCC historical data, CCC milestone data5, ETO data, and the Counterfactual and Holistic Transition scenarios from the Energy System Operator’s Future Energy Scenarios.14 The forecasts up to 2050 vary considerably, with the FES holistic transition and CCC milestone forecasts both achieving over 65% reductions between 2023 and 2050, while the FES counterfactual and ETO forecasts show only a 25% reduction – although the ETO reduces demand faster and is consistently lower than the FES counterfactual.
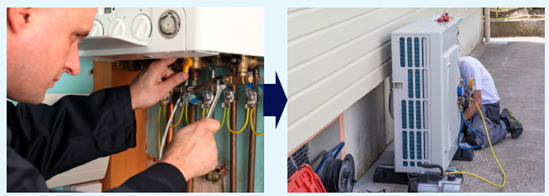
Targets for heat pump installations, replacing natural gas boilers in most cases, have been in place since 2010. The rate of installations achieved so far is lower than expected - less than half of those planned for, by December 2023.15 However, heat pump applications to the Boiler Upgrade Scheme have been increasing, being 40% higher in January 2024 than in January 2023,16 and 75% higher in February 2024 compared to the previous February.17
Key factors influencing household decision making on heat pumps include the often disruptive and expensive building upgrades that are required, such as replacing radiator systems with low heat versions; the higher capital cost; and the fact that electricity is far more expensive per kWh than gas. Figure 3 shows heat pump installation in new and existing homes. The ETO forecast is close to the FES counterfactual, and the CCC milestone and FES holistic transition scenarios are similar in expecting a very fast increase in heat pump installations after 2025. The ETO forecast achieves only around three quarters of the installations in the CCC milestone data between 2023 and 2050.

Electric vehicles
Efficiency of cars is influenced by many design factors. In general, the higher the performance and comfort such as increased size, more acceleration and air conditioning, the lower the efficiency. Other influences on efficiency include overall vehicle weight, aerodynamic design, drivetrain design, regenerative braking, engine efficiency, and width of tyres. The share of low carbon vehicles in the UK passenger car fleet has been growing slowly over the past decade but is still quite small. Figure 4 shows that as of 2023 only 5% of cars have an emissions rating of less than 75 gCO2/km and the average rating is 132 gCO2/km.18

Conclusions
Household electrification will likely be slower than planned for, and may not happen in all homes
Replacing large fleets of technologies
Mass consumer products such as cars and boilers are adopted by society in a typical pattern called technology diffusion. It starts with technology development, then adoption initially by a small percentage of innovative consumers, and eventually growing to saturate the market and become the new normal. It takes time to improve new technologies to the point they are reliable and trusted by consumers, and this type of improvement (known as technology learning) which only happens as customers adopt and use them.
 The rate of transformation of a technology fleet depends on (i) what percentage of the fleet is replaced each year, and (ii) the technology chosen to replace or add equipment. Consumers do not have “perfect foresight” in knowing which technology option will eventually win out over competitors. For example, in the early days of automobiles electric vehicles were competing quite well with petrol vehicles19 but eventually petrol vehicles went on to dominate the market.
DNV’s ETO forecasts that the CCC milestones will be achieved at a much slower rate than expected due to the modelling method used. In modelling a “most likely” future the ETO takes into account the slow rate of replacement, the uncertainty about consumer choices of technology replacements and additions, and the rate of technology learning.
The ETO modelling approach creates forecasts that more closely represent how real-world technology adoption happens: progress is slow for a while but eventually speeds up once growth becomes self-generating. |
Decarbonisation and policy
There are five key uncertainties that are important to monitor:
- Societal responses to technologies. Domestic building heat and passenger road transport are similar in that demand technologies are owned and operated by households and not by professionals (such as in organisations). Energy technologies provide transport and heat to householders as part of their everyday life; they are not something that people necessarily want to spend time thinking about.
- Supply chain responses to policy. Policy uncertainty can unsettle supply chains, especially manufacturers who need to do product design and build production facilities far in advance of when technologies reach the market. For example, in 2023 the government’s target year for phasing out new diesel and petrol cars was delayed from 2030 to 2035, although it may now be moved back to 2030.20 This changing of targets impacts plans made by car manufacturers, and the companies and local authorities building charging stations. One policy decision critical for heat pump suppliers is whether government will back hydrogen gas for heating. This uncertainty is hampering investment and effective planning.21
- Power supply and distribution changes. The envisaged widespread electrification will mean rapid and transformative changes to power supply and distribution. Not only will huge amounts of new generation capacity need to be built and integrated into the transmission grid, much of it as variable renewables generation, the transmission and distribution grids will require unprecedented investment to deal with much higher peak demand. Power distribution networks are investing in local grid improvement programmes, yet challenges remain in digitising the networks and creating an accurate picture of the impacts of future demand growth.
- Suitability of homes for heat pumps. There are divergent opinions on the potential for heat pumps in UK housing stock. For example:
- A pessimistic view finds that (out of a sample of homes surveyed), on average, only 40% of homes are heat pump-ready; 16% of homes could be made suitable for heat pump retrofit through building energy efficiency measures such as cavity wall insulation; and 37% to 54% of homes are likely not suitable due to a lack of exterior space and/or unsuitable thermal properties of the building fabric.22
- A more optimistic view is that most homes could be heated with heat pumps, even without whole house improvements such as insulation and double glazing - although average fabric improvements of 30% to 50% will be needed. To support this approach, an ‘understanding first’ approach for individual buildings should be taken in which the costs and savings for different building types and conditions are considered along with the needs of occupants for comfort and health.
It is unclear which of these two views will turn out to be closer to reality – and there are many other views in between. In practice, it is common for trade offs to be made between improving building efficiency and the size of heating systems. DNV’s ETO takes a balanced view, adding heat pumps in homes with a wide variety of efficiency ratings to reflect practical decision making.
- The price of electricity. The price of electricity in the UK is one of the highest in Europe and much higher than the price of natural gas per kWh. For EVs, if people charge their cars at commercial charging stations with a higher price compared to home charging, running costs are not very competitive with an efficient petrol or diesel car. For heat pumps, despite them being three to five times more energy efficient than gas boilers, the electricity price needs to be no more than double the price of gas to make them a good investment, and in the UK that ratio is over 3.5.23 There have been calls for reforming the UK power market, since natural gas is still the main driver of wholesale electricity prices; the benefits of cheaper renewable power need to be seen by energy customers.24
Notwithstanding these uncertainties, there is enough ambition and industrial capacity for the UK to achieve close to complete decarbonisation of household energy by 2050. With the right kind of governance and policy, innovation in manufacturing and the energy sector, and public willingness to adapt and change, we see progress being much faster than a business-as-usual forecast. The key need is to get a grip on all of the practical realities and uncertainties affecting household electrification and deal with them quickly. When it comes to transforming large fleets of consumer equipment, time is of the essence.
1 DESNZ: Digest of UK Energy Statistics (DUKES) 2023
2 DESNZ: Final UK greenhouse gas emissions national statistics: 1990 to 2022
3 CCC: Mitigation Monitoring Framework - Chapter 3. Buildings
4 HM Government: Heat Pump Investment Roadmap PDF (assets.publishing.service.gov.uk)
5 Department for Transport: Decarbonising Transport – A Better, Greener Britain PDF (assets.publishing.service.gov.uk)
6 Department for Transport: Government sets out path to zero emission vehicles by 2035
7 CCC: Progress in reducing emissions 2023 - Report to Parliament. Supplementary indicator data. XLSX
8 Department for Transport: Vehicle licensing statistics data tables - Licensed road using cars and light goods vehicles by local authority, body type, fuel type, CO2 band, keepership, and year of first registration, VEH9901”, 2023
9 Useful energy is the energy that goes towards producing the desired output of the end-use equipment, such as light from a lightbulb and kinetic movement of a car.
10 Primary energy is energy that is used as a resource, such as oil and natural gas, before it has been transformed.
12 Pasini, G., Lutzemberger, G. and Ferrari, L. (2023): Renewable Electricity for Decarbonisation of Road Transport: Batteries or E-Fuels?
13 Energy Policy: Rosenow, J. et al. (2018) ‘The remaining potential for energy savings in UK households’, 121 (June), pp. 542–552.
14 NESO: Future Energy Scenarios (FES) Note: The counterfactual illustrates the gap between successful tracking of FES pathways versus change happening too slowly and key targets being missed.
15 NAO: Low heat pump uptake slowing progress on decarbonising home heating
16 NAO: Decarbonising home heating PDF
17 DESNZ: Heat pumps in demand as grant applications soar by 75%
18 VEH0206: Licensed cars at the end of the year by VED band and carbon dioxide (CO2) emissions: Great Britain and United Kingdom XLSX
19 MOTORTREND: Electric vs Gasoline Cars: History Shows This is Nothing New
20 PARKERS: DfT confirms ban on petrol and diesel cars will be moved from 2035 to 2030
21 Energy Utilities Alliance: Decarbonising heat in buildings - Putting Consumers First (2021) PDF (eua.org.uk)
22 Buildings and Cities: Eyre, N. et al., Fabric first: is it still the right approach? (2023), pp. 965–972. Link.
23 EHPA: In which countries does the electricity price work for heat pumps?
24 UCL: Electricity prices dictated by gas producers who provide less than half of UK electricity
12/5/2024 8:00:00 AM