Using RAM in Offshore Wind Project Series - Operations Phase

Balancing Costs and Reliability in Offshore Wind Operations
It may sound like a cliché, but it’s still true – organizations everywhere face ongoing challenges to maintain optimal operational uptime for production critical equipment despite limited maintenance funds, increasing equipment complexity, and accessibility to competent workforce. This is especially true for offshore wind farm operations. Though the operations of these turbines are simple enough, the technology is not. Maintenance is a constant source of headaches. Due to the rough seas and constant exposure to saltwater, winds, and waves, offshore wind turbines are subjected to significant wear and tear. Regular maintenance is essential to maximize their lifespan and keep them operating at peak performance. Maintenance teams typically face unique challenges, including logistical hurdles of working at sea, often in remote locations far from shore.
Traditional operation and maintenance methods adopted from land-based assets are not sufficient to meet the Operations and Maintenance (O&M) requirements of offshore wind farms. Studies suggested that O&M costs accounts for a large portion of the Levelized Cost of Electricity (LCOE) of an offshore wind farm, constituting 23% of their total investment cost, compared to only 5% for onshore wind turbine operations1. Therefore, it is important to establish a comprehensive framework to reduce the O&M costs for sustainable operations of offshore wind farms.. In this article, we’re going to explore how to figure out if a maintenance strategy has the right balance for both finance and performance and explore how to compare maintenance strategies in terms of Lifecycle Cost analysis (LCC) using Reliability, Availability and Maintainability (RAM) methodology.
RAM Approach to Tackling Maintenance Challenges
Reliability, Availability and Maintainability (RAM) analysis is a methodology used to predict asset performance based on reliability and maintainability. This methodology is well established and used in many domains such as the oil and gas and transport industries, and increasingly in the renewables industry.
With wind turbine capacity, equipment reliability, dynamic feed and demand, crew availability, weather conditions, spare parts availability, supply chain issues, etc., it’s nearly impossible to calculate the impact of one change to a system — because all these factors are highly interrelated, and one change can start a chain reaction of events. To simulate all these interconnected uncertainties, DNV’s RAM tools Maros and Taro applies Monte Carlo simulation technique, which is based on repeated random sampling to obtain numerical results. This assigns random values to model variables – for example, process downtimes and equipment repair times – based on probability distributions. RAM considers the uncertainty inherent in complex systems such as in an offshore wind farm, it can provide alternative approaches compared to deterministic analysis in which fixed values are used for model variables.
Factors Affecting the Availability of a Wind Farm
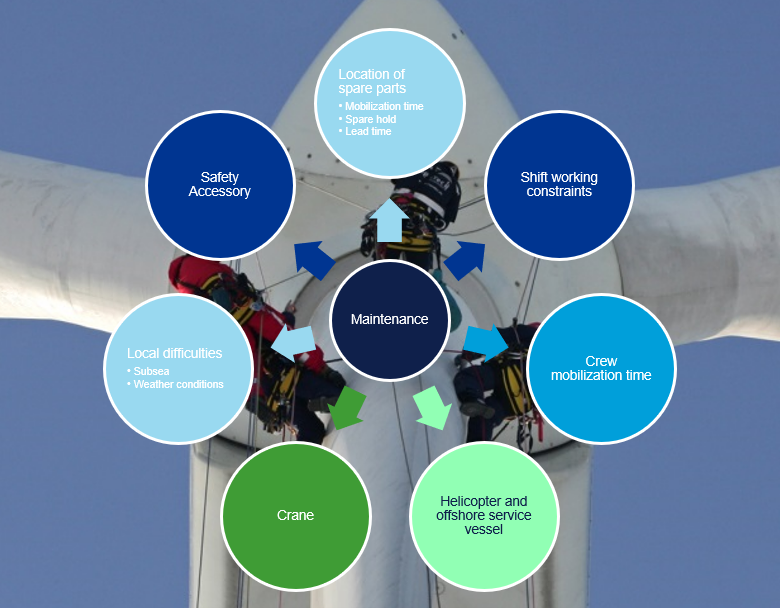
While it's undeniable that commercial wind turbines can achieve high availability levels, often reaching 98% or higher2, this comes at a cost. With regular proactive servicing at least twice a year, operators must navigate a delicate balance between uptime and downtime, striving to ensure continuous production while addressing potential failures before they escalate. This makes it inevitable to assess the O&M demand of an offshore wind farm to achieve the required availability level against optimal cost expenditure. Many factors contribute to the high availability that is within the control of the owner/operator. Apart from equipment reliability, maintainability plays a role in the availability level that can be achieved. The maintenance strategy considers some of these elements as shown in Figure 1:
a) Preventive maintenance: Preventive Maintenances (PMs) serve to inspect, identify, and rectify potential component However, while increased PM frequency enhances reliability, it concurrently escalates maintenance costs and extends wind turbine downtime, subsequently diminishing system output.
b) Crew: The maintenance crew is formed of technicians, and sometimes specialized personnel are required to perform specific maintenance tasks. One of the biggest challenges is getting maintenance crew to and then on and off the offshore turbines to carry out work. There are two major factors that influence the approach taken to gaining access:
- Travel time – the time needed to shuttle a service crew from the crew base to the place of work. Several constraints must be considered such as limited shift hours available, the mobilization time taken to prepare the crew as well as the travel time to transport crews to different locations in the wind farm.
- Accessibility – after getting on the wind turbine, there is a window of time where the turbine can be safely accessed. This will obviously depend on the transportation means and the sea conditions. For example, rough seas will prevent a vessel to transfer crew and equipment.
c) Vessels: Service Operation Vessels (SOV) are an important part of any offshore wind maintenance strategy. These boats are essential for logistical services by transporting technicians and equipment from land to the wind farm. The services are extended depending on how far offshore the sites are. For example, distant offshore sites may also use workboats to ferry technicians between the offshore base and turbines.
d) Air transport: In the realm of offshore wind farm maintenance, helicopters often play a pivotal role in ensuring the seamless operation of these expansive turbine These aerial vehicles provide a swift and efficient means of transporting maintenance crews and equipment to and from the remote offshore sites. They are particularly important when environmental conditions, such as sea state conditions, make the wind turbine inaccessible. The potential downside to using air transport is the higher cost for mobilization.
e) Spare parts and consumables: Spare parts and lubricants are typically required to repair equipment caused by unscheduled failures or even on an opportunistic basis (e. planned). This practice is commonly implemented across various systems, aiming to mitigate unscheduled repairs by strategically scheduling inspections, overhauls, or equipment renewals at regular intervals. The overarching goal is to enhance the long-term productivity and reliability of the system.
Considering the maintenance planning is a long-term decision problem and the wind is random, long-term wind prediction is required for owners and operators to evaluate the loss caused by maintenances to be executed in the future. However, long-term wind prediction is complicated and is much harder than the short-term (e.g., day-ahead) prediction. To overcome this, stochastic model has been applied in the RAM model to overcome this complication, with the aim to simplify the optimization model of maintenance planning and obtain good application performance simultaneously.
Case Study – Reliability Block Diagrams
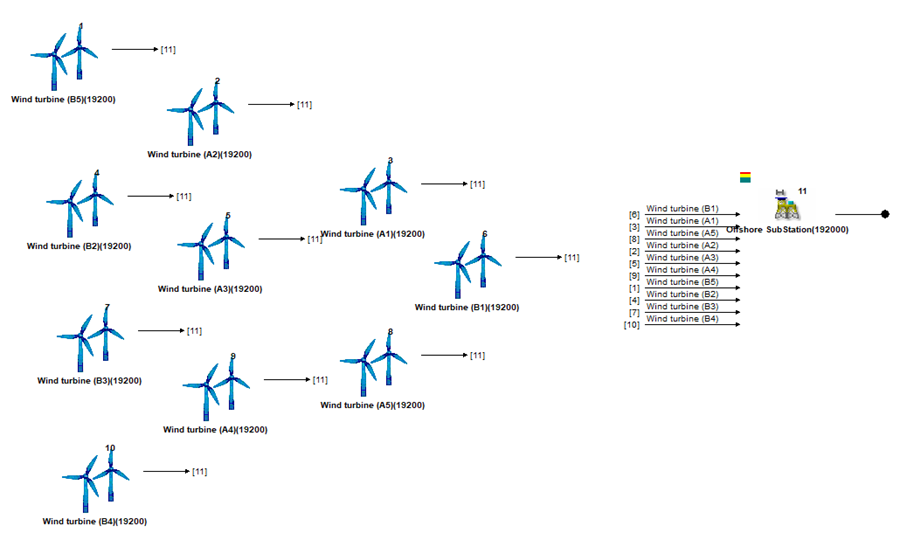
The offshore wind farm consists of 10 wind turbine generators, each with a 2MW installed capacity, giving the farm an aggregate 20MW installed capacity. The base case model consists of both the wind turbines and Offshore Substation (OSS) with the following considerations:
- All wind turbine systems have similar components.
- Some clusters consistently receive high wind speeds, while others receive lower wind speeds.
- The tower and sub-structure of the wind turbines are not included in the model.
- Corrective Maintenance (CM) will be carried out whenever a fault is detected on first-come, first-served basis.
When performing a RAM study, a Block Flow Diagram (BFD) defines the connectivity of nodes and focuses on the production aspects of the system e.g. production profiles. Each node within the network will require its own Reliability Block Diagrams (RBDs).
Reliability Block Diagrams (RBDs) are used to outline the logical relationships between the different events as shown in Figure 3. Each one of the blocks in a Reliability Block Diagram represents one “event” that can lead to production loss. RBDs are a logical representation of the system connection considering path of success of the system mission, in this case electricity generation. If you have items in series, when one of them is in a failed state there is no way for the system to move forward. However, if you have items in parallel, it means that there more than one “success” path in the system.
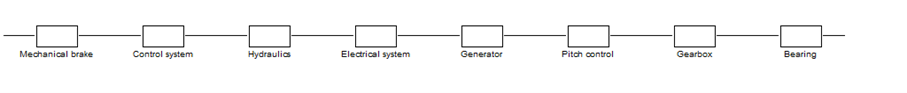
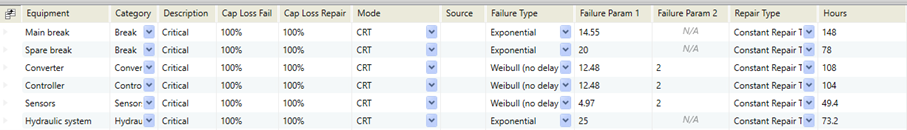
Once we know what equipment items to be included in the model, we start looking into collecting reliability data. Typically, these data could be sourced from industry, vendor, or in-house data. Commonly used failure and repair distributions are supported in DNV’s Maros and Taro includes Exponential, Weibull, Normal, Log-Normal, Triangular, Rectangular etc.
Case Study – Maintenance Resources Logistics
An extensive number of maintenance resources must be accounted for when performing a RAM study. It is important to understand how these logistics manifest themselves in the simulation. Consider a generic event, a failure, or a planned shutdown. In real life, this failure will start being repaired with a certain delay time corresponding to the time required to diagnose the problem and organize the repair resources to carry out necessary repairs. Once all resources are on the job location, the actual repair procedure can commence. The repair action itself may impact the production in another manner.
Modelling maintenance logistics involves determining the ‘repair delay’ portion of the above sequence. This is achieved by defining the location, quantity and constraints of the various resources involved in the repair process. Simulation is then carried out to determine each repair delay depending upon the foregoing and the workload at the instant of the failure. It is not simply a case of specifying a repair delay per task.
This model presents a great level of detail regarding maintenance strategy – remember the offshore windfarms are far from shore so it is requiring special type of maintenance strategy. For this case study, different profiles will also be used to classify the maintenance tasks required for the class of equipment items:
- Different CMs have been configured with the appropriate resources (i.e. large spare parts require larger vessels and more crews etc.)
- Planned maintenance is carried out every 6 months supported by a helicopter with 4 crew members and the associated spare parts. Maintenance crew requires 2-4 hours mobilization time with 0800 to 1600 shifts.
- Costs associated with spare parts, mobilization and hourly rates for the crew, vessels and helicopter have been accounted for.
Case Study – Base Case Results
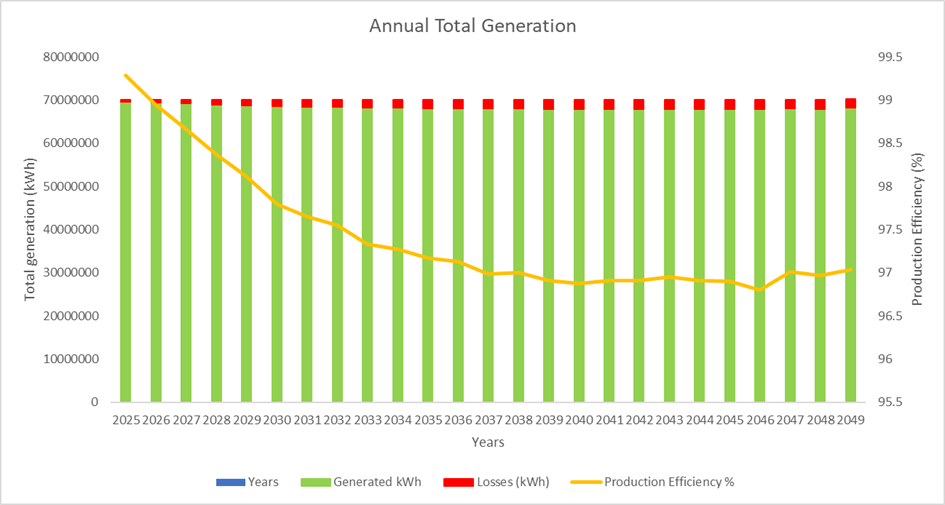
The virtual model for the wind turbine simulates 12500 cycles. This means the model is sampling events for 500 different lives of 25 years. The calculated production availability for the system is 97.42% with a standard deviation of 0.15%. This forecasted production availability is averaged from all the simulated lifecycles. One interesting trend on this graph is the increasing blue bar, representing the increasing losses, which should be expected since we have failure distributions that describe an increasing failures rate with time.
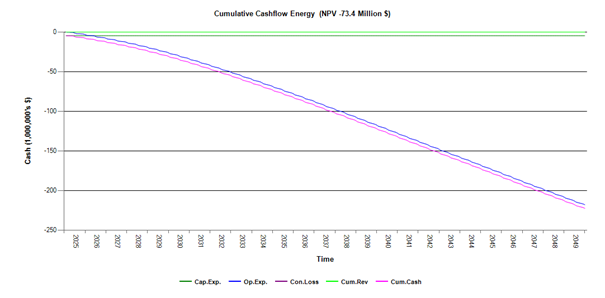
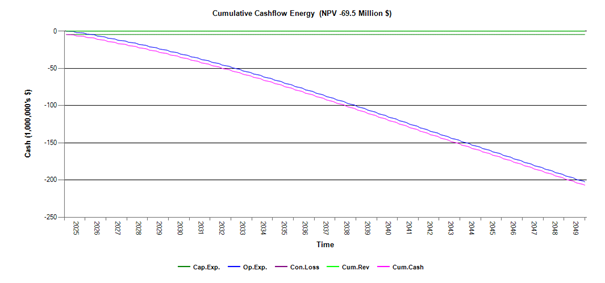
A view of the financial aspects of the venture can also be evaluated looking at the cash flow, operational expenditure, and cumulative revenue. Maros and Taro utilizes Net present Value (NPV), which is a financial figure that allows comparisons between different scenarios by using all the cash flows from the project and adjusting them to their present values by applying the appropriate discount factor. The scenarios then become directly comparable. Should the present value of the capital inflows exceed those of the outflows after the selected discount rate has been applied, the project is showing a positive cash flow return and the greater the value the better. The graph below shows the lost production recovery opportunity. By adopting the 25 years economic lifetime and a yearly discount rate of 10%, the resulting NPV of -$73.4M shows how much money the wind farm operator can recover if they can optimize the system to avoid generation loss and to minimize the negative NPV as shown in Figure 6.
Preventive Maintenance Optimizing Options
To prevent a failure from occurring, a maintenance team should visit the wind farm frequently. However, unnecessarily frequent visits, on the one hand, are inefficient and expensive due to the high amount of maintenance vessels and personnel required. On the other hand, a lower visit frequency may result in a higher failure rate and, consequently, longer downtime. Therefore, maintenance frequency is a trade-off among risks, vessel capacities, human resources, and so forth. A successful maintenance strategy aims to maximize economic benefit, extend components lifespans, reduce the number of emergency repairs, decrease overtime labor costs, and relieve the working stress of unpredictable equipment failures. As the scale of offshore wind farms expands, a corrective maintenance strategy is no longer suitable and is gradually being replaced by proactive maintenance strategies.
The goal of preventive maintenance strategy is to optimize the production plan and the economic maintenance plan. For this case study, a few optimizations potential strategies are going to be explored. Preventive maintenance strategies can be optimized by:
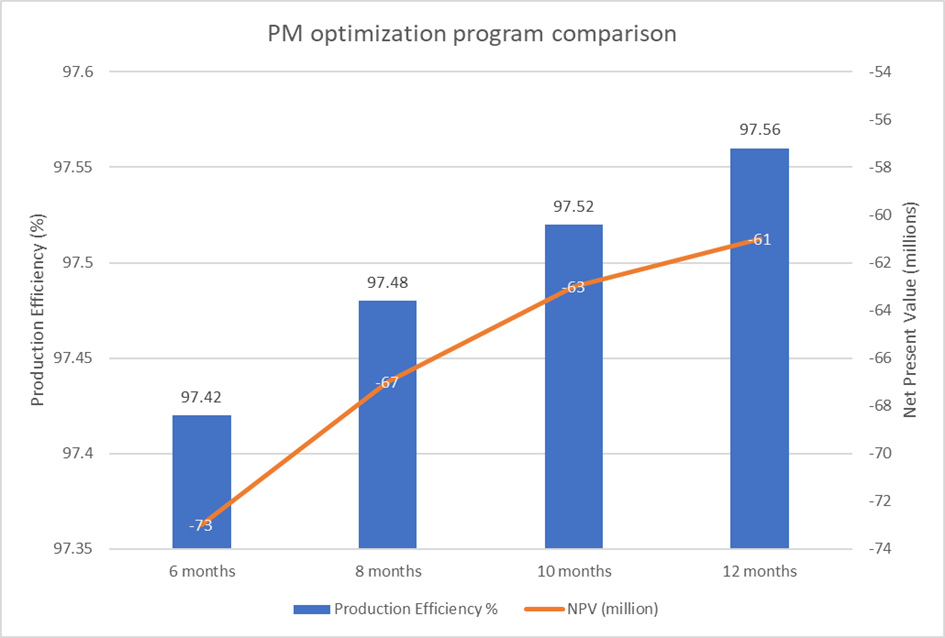
a. Optimizing on predetermined interval: Operators continuously collect degradation data in operations that better reflect the probabilities of failure for specific components. This information gives them insights into how they can optimize the selection of predetermined intervals more effectively using the risk-based approach. Through sensitivity analysis performed by increasing the planned maintenance from base case of 6 months to incremental 2 months in the example below, there are benefits in terms of increasing the overall production efficiency as well as reducing the negative NPV (better profitability due to higher electricity generation). Nevertheless, further assessment is needed to ensure that increasing the intervals between planned maintenance would be technically feasible without compromising the integrity and reliability of critical components.
b. Opportunistic maintenance: Opportunity maintenance is a special case of preventive maintenance in which equipment is renewed on an “opportune” basis. For example, if the repair of certain equipment requires specialist services which are not readily available but happen to be on location it may be prudent to carry out such renewals before failure occurs. In such cases, there may also be a gain in the normal replacement time of the equipment if it is opportunely replaced as the resources have been mobilized for adjacent activities.
Also, on difficult maintenance work it may be cost-effective to renew more than just the failed part to reduce the frequency of such tasks. There are many instances in which opportunity maintenance can be considered, however, there is almost always a trade-off in terms of short-term losses or increased operating costs against possible long-term gains. The pros and cons are difficult to quantify and judgement in the past has relied on qualitative methods. DNV’s Maros ad Taro offers a means of developing cost effective strategies which can be justified on a quantitative basis rather than a subjective assessment.
In the example shown in Figure 8 below, opportunistic maintenance has been defined as replacing the main bearing that have an in-situ life greater than 20% of expected life whenever an unscheduled repair is conducted saving on normal repair time is 99%.
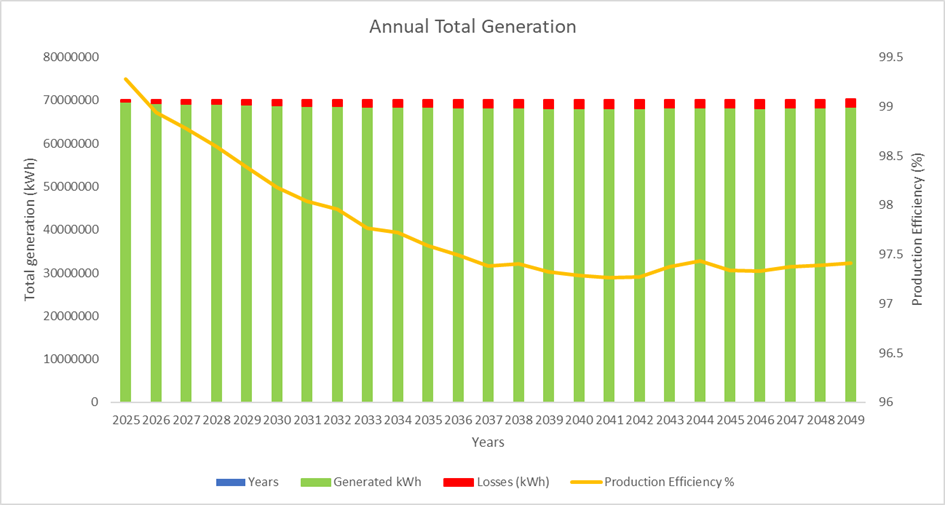
This alternative strategy results in a production efficiency of 97.78% and an NPV of -$69.5 million shown in Figure 9, representing an improvement over the base case. However, further evaluation is needed to determine whether this strategy aligns with the current available resources or if additional investments are necessary to augment current spare holdings.
c. Prioritization: At peak and off-peak periods of power generation, each wind turbine generator (WTG) on a utility-scale wind farm receives different wind speeds due to their varying geospatial locations. This variation significantly affects their long-term productivity and maintenance demand. Hence, ranking WTGs according to their resource advantages could be helpful when prioritizing maintenance activities.
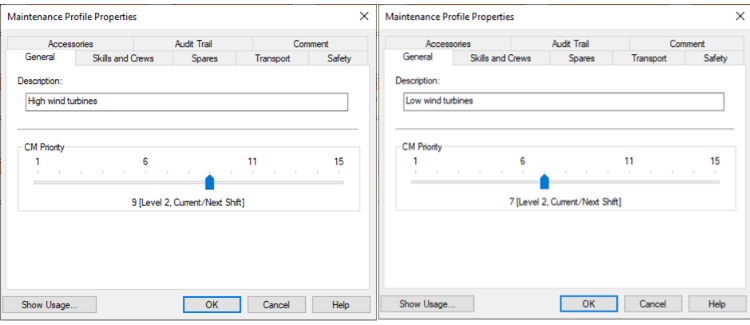
Turbines with more wind advantage will necessarily require priority maintenance owing to increased productivity and wear rate. This condition can be used to prioritize maintenance activities on the wind farm amidst other significant benefits. Using the same model, high yield wind turbines A1, A5 and B1 have been assigned with higher priority than other low wind turbines. Using Maros and Taro, simulation was performed to determine whether prioritizing the corrective maintenance for the high wind clusters would offer any benefit to the overall productivity and financial performance.
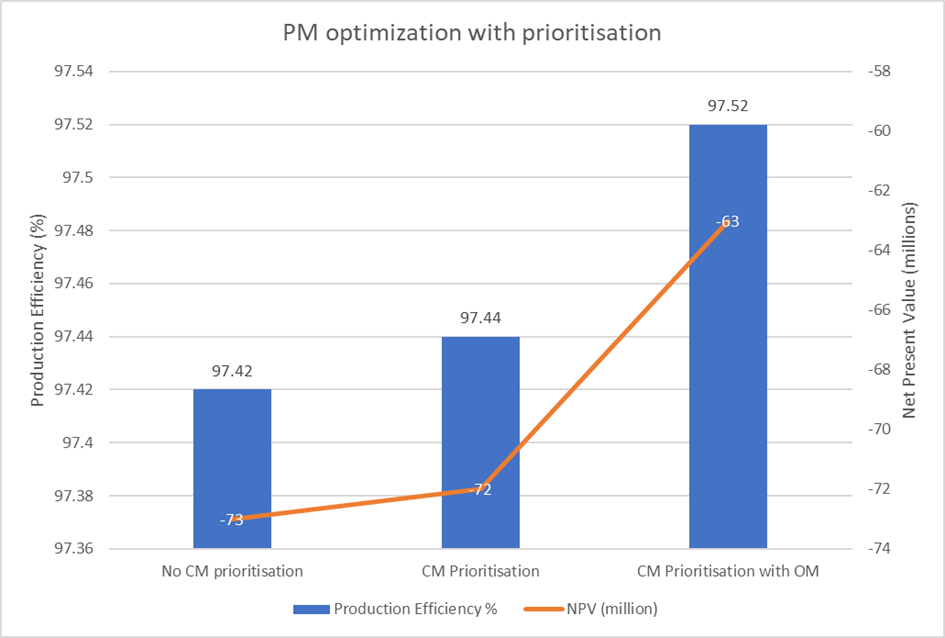
The results shows that while there is an increase in the profitability and production efficiency, further benefits can be obtained by combining the prioritization strategy with opportunistic maintenance.
d. Increasing transport availability: With the base case (one helicopter, one large vessel, and one normal vessel) compared with the case where a higher number of resources are assumed to be available, the low and high limit for the performance can be calculated. A table is then built up varying the number of transportations showing how they influence the overall performance and what the overall return on investment is. The return on investment for each case can also be calculated. The negative NPV shows the lost opportunity (financial losses) when operating the system.
|
Resource |
Production Efficiency (%) |
NPV (million) |
|
Base Case |
97.42 |
-73.4 |
|
2 vessels |
97.71 |
-73.6 |
|
3 vessels |
97.71 |
-73.6 |
|
2 large vessels |
97.57 |
-73.5 |
|
3 large vessels |
97.58 |
-73.5 |
|
2 helicopters |
97.60 |
-73.6 |
|
3 helicopters |
97.61 |
-73.6 |
The sensitivity analysis above also shows that the maximum production efficiency is achieved with additional transport resource for each case and adding more would have diminishing returns. A more thorough analysis could then be performed to check:
- Availability of these transport around the wind farm area,
- Reliability and maintainability of the transport facilities,
- Seasonal repairs which demand the transport resources to be available more often during a specific season
- Metocean data that would incur some restrictions to travel and so on.
This would then feed back into the analysis supporting the decision on how many transportation resources should be contracted with selected defined criteria on cost and revenue.
Wrapping it up…
To conclude, optimizing long-term preventive maintenance planning is essential to enhance the economic viability of offshore wind farms. It means that we need to ensure that maintenance activities are executed at optimal times, striking a balance between reliability enhancement, and minimizing downtime-related productivity losses. These routine preventive maintenances, involving scheduled inspections and servicing, are indispensable for averting component degradation for the vital elements. However, these parameters are interconnected and often in conflict. Increasing one may compromise the others. For instance, overly conservative maintenance strategy may boost reliability but hinder profitability. Conversely, overly simplistic maintenance procedures may sacrifice reliability. RAM analysis harmonizes these trade-offs, guiding wind farm operators toward optimal maintenance strategies, predictive planning, and cost-effective spare parts management.
How DNV can help
Grounded in our expertise in technical and regulatory aspects, DNV supports owners in realizing wind projects in a safe and cost-efficient manner. We have the technical expertise that enabled us to work on 97% of the world’s offshore wind projects. With a deep understanding of the entire offshore wind system, DNV helps stakeholders to mature offshore wind concepts from the idea to implementation. And the great thing is coupled with advisory insights and wide range of software solution, DNV’s RAM tools Maros and Taro can be applied to help provide faster and more accurate decision-making in striking a balance between reliability enhancement and minimizing downtime-related productivity losses. With technology that gives you an up-close look at the entire system and models the effects of changing conditions throughout, you can decide what adjustments to make with complete confidence and maximize your return on investment.